
Reports in WooCommerce give you the ability to see your store’s performance from month to month using graphs and stats. It has four sections: Orders, Customers, Stock, and Taxes.
To view them, go to: WooCommerce > Reports.
Orders
Orders allow you to view gross and net sales volume and totals, as well as top sellers, top freebies, top earners, and product downloads. Sub-sections are shown below.
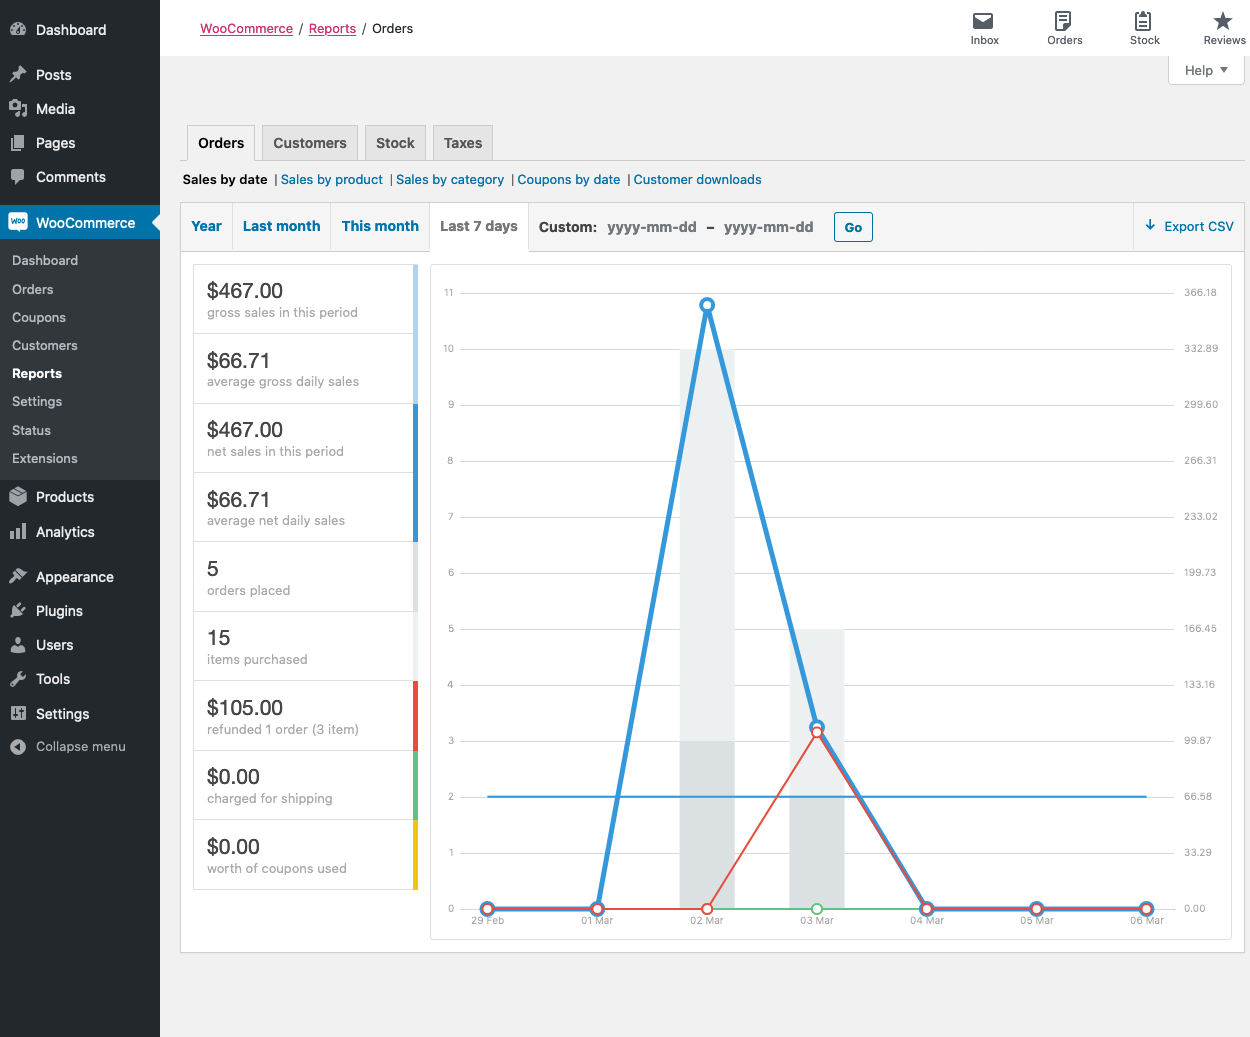
Sales by date
The Orders tab starts with Sales by date. This gives you an idea of the current performance via a sales graph and a few way ways to drill down into data. By year, last month, this month, last 7 days, and a custom date range.
The sales graph itself shows the number of gross sales plotted on a light blue line, the net sales plotted in dark blue, the shipping amount plotted in green, refunds plotted in red, and coupon values redeemed in orange. Hovering over a point will give you the exact figure.

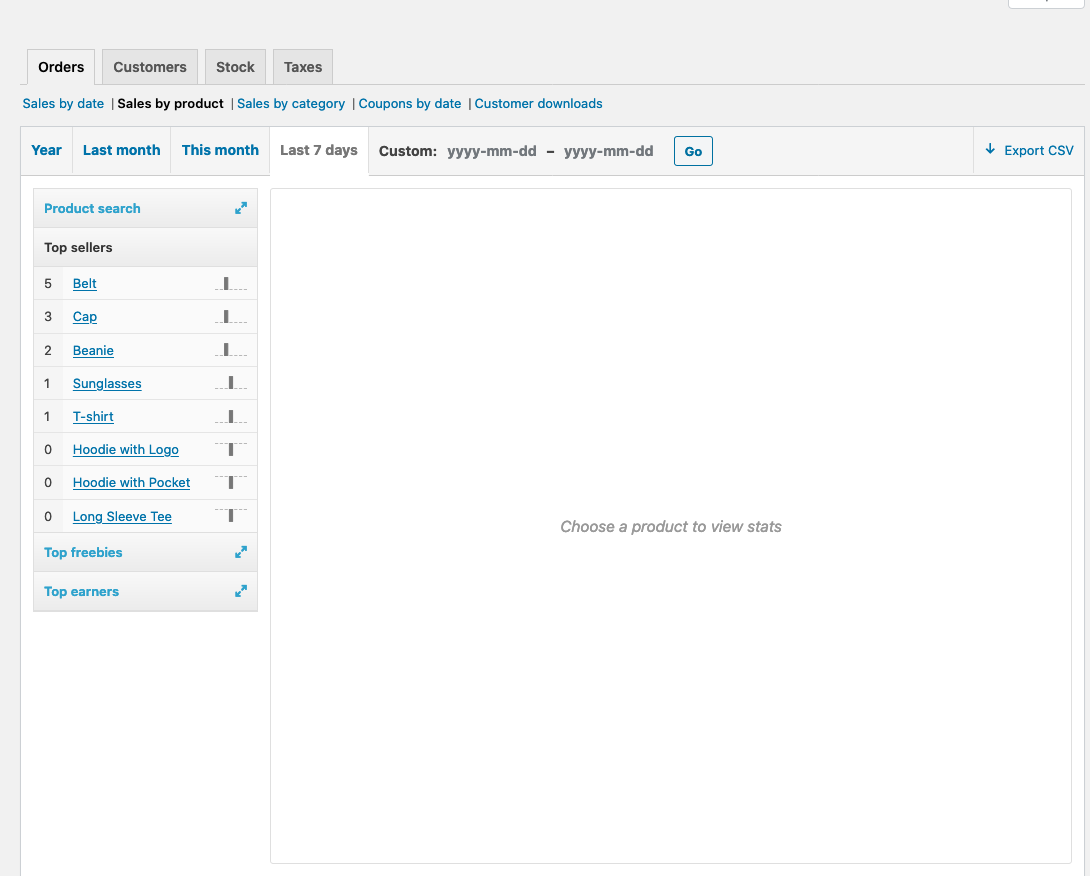
Sales by product
The sales per product section shows sales per day in a given range, similarly to the overview section:

You can select any product from your store to view sales data, and again drill down into by year, last month, this month, last 7 days, and custom.
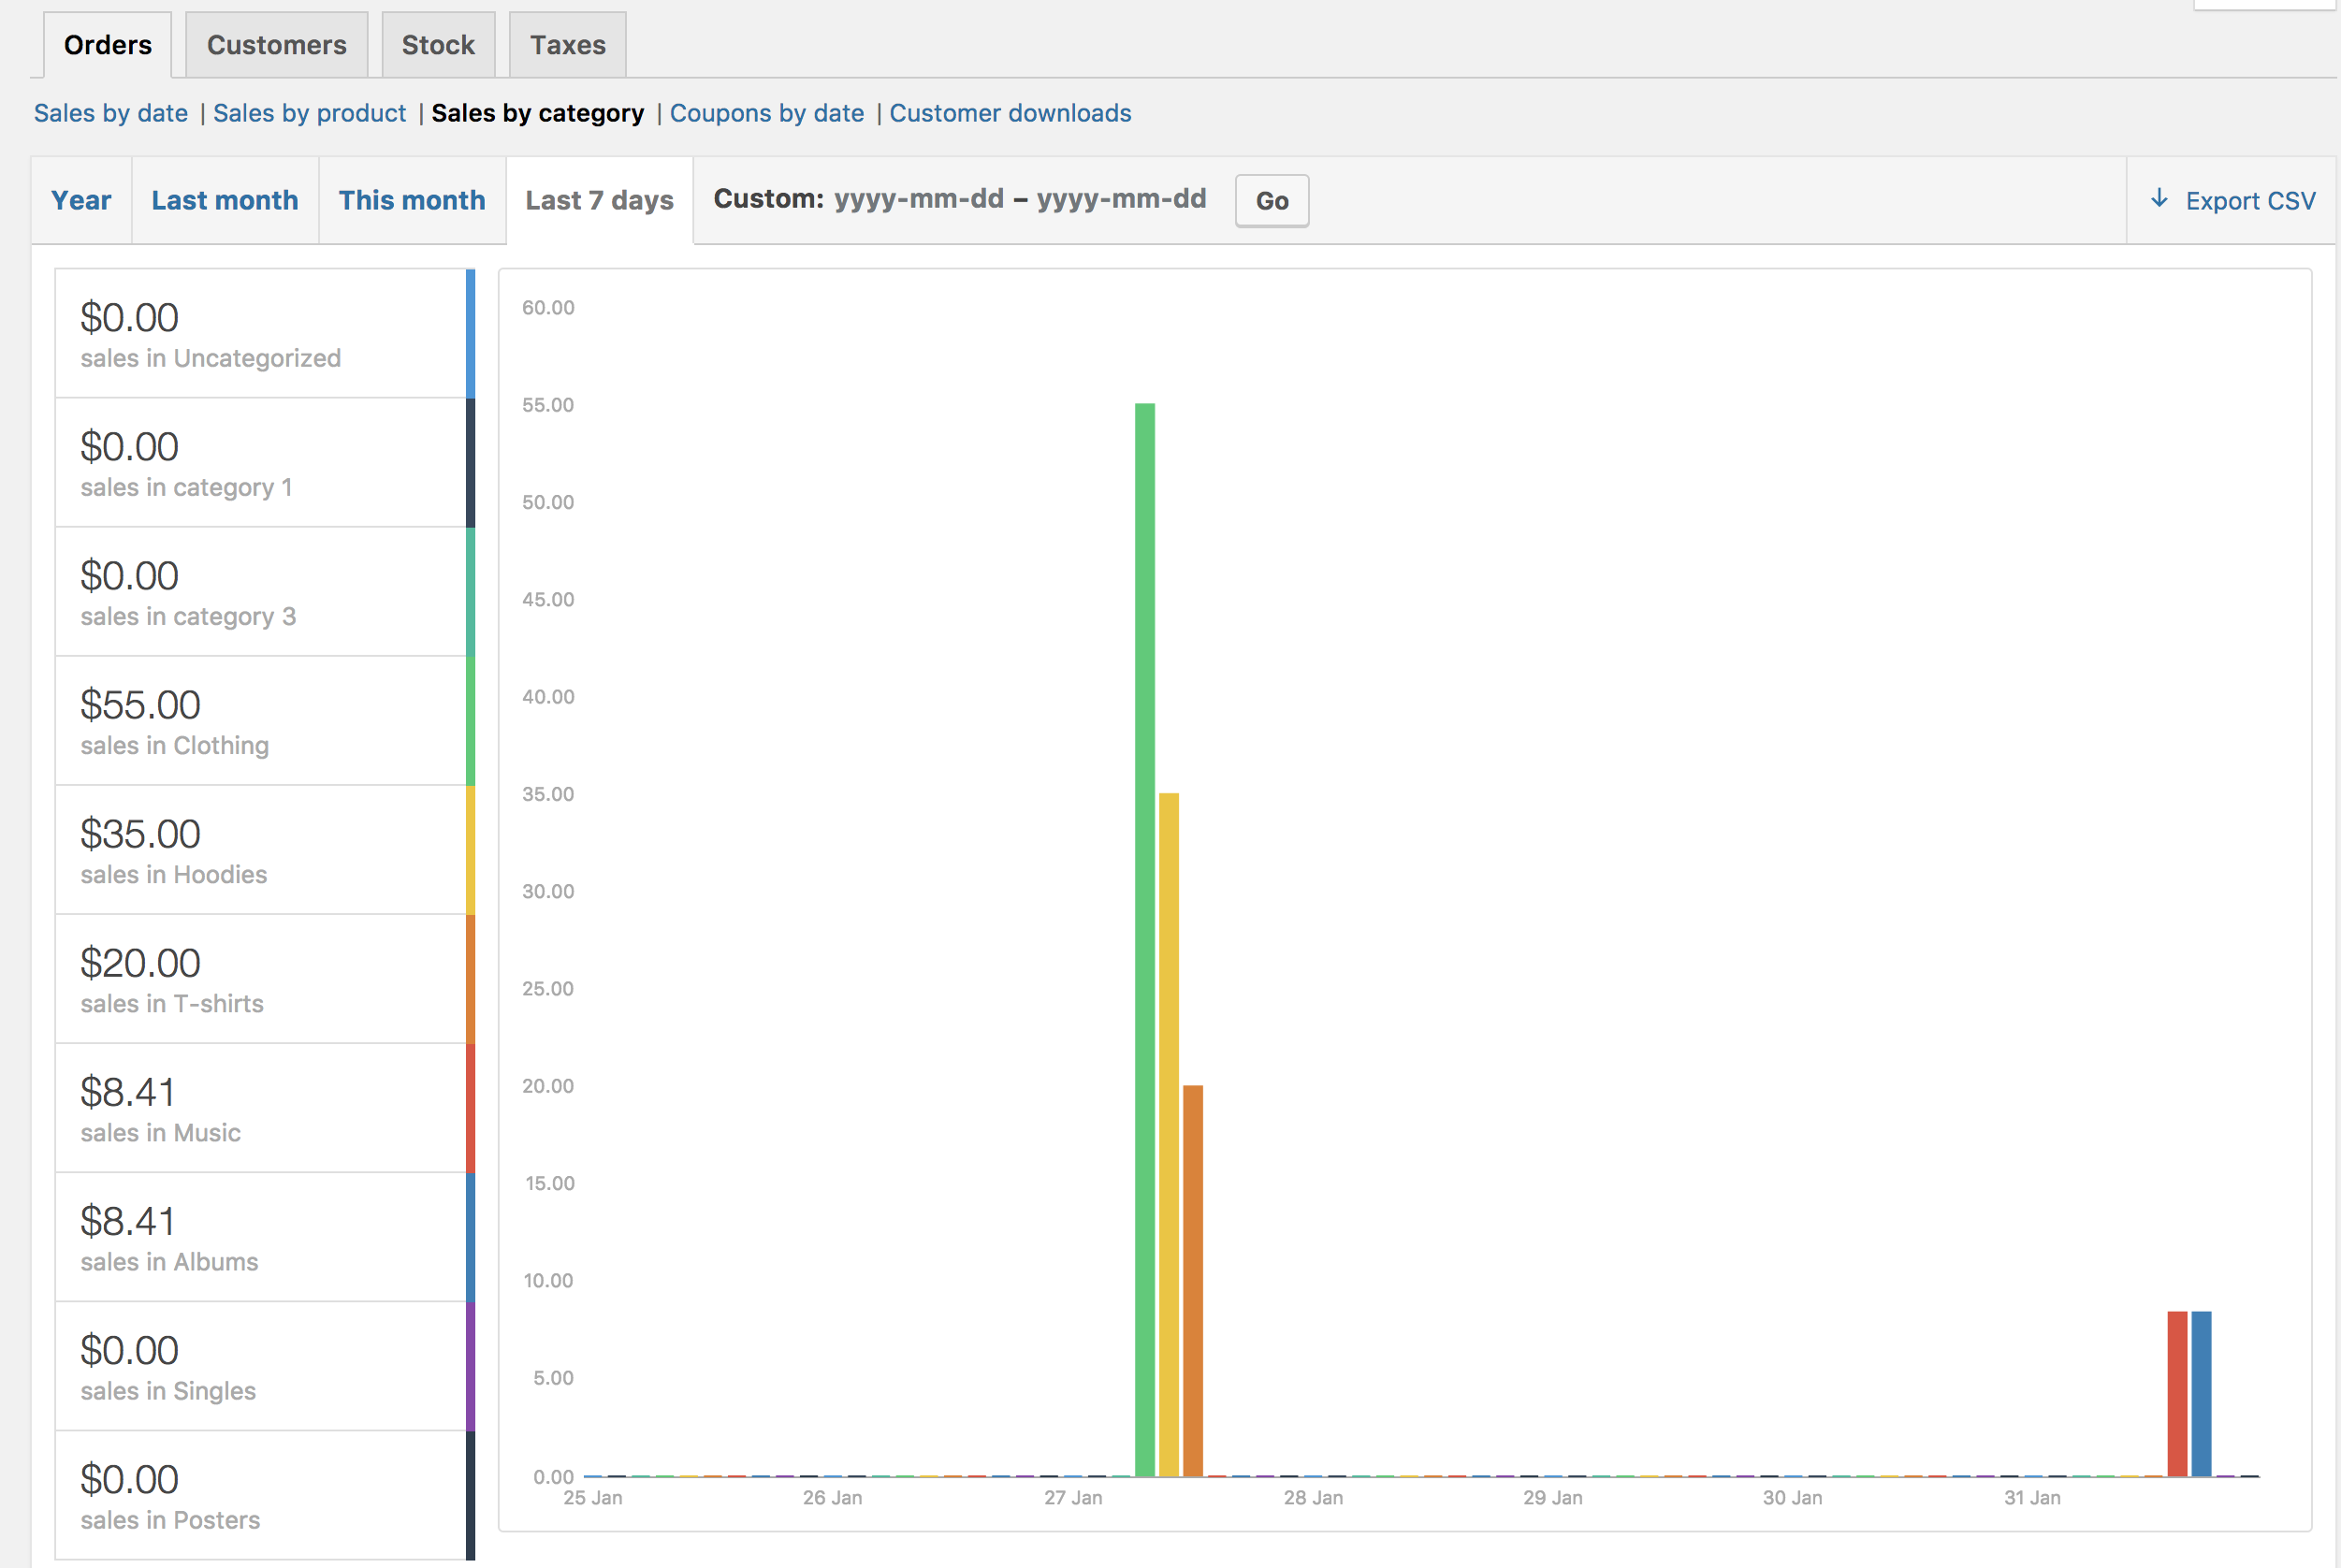
Sales by category
You can also view sales numbers by category.
- In the Categories widget, select the categories you want to review. (Or select “All”)
- Then, select “Show”
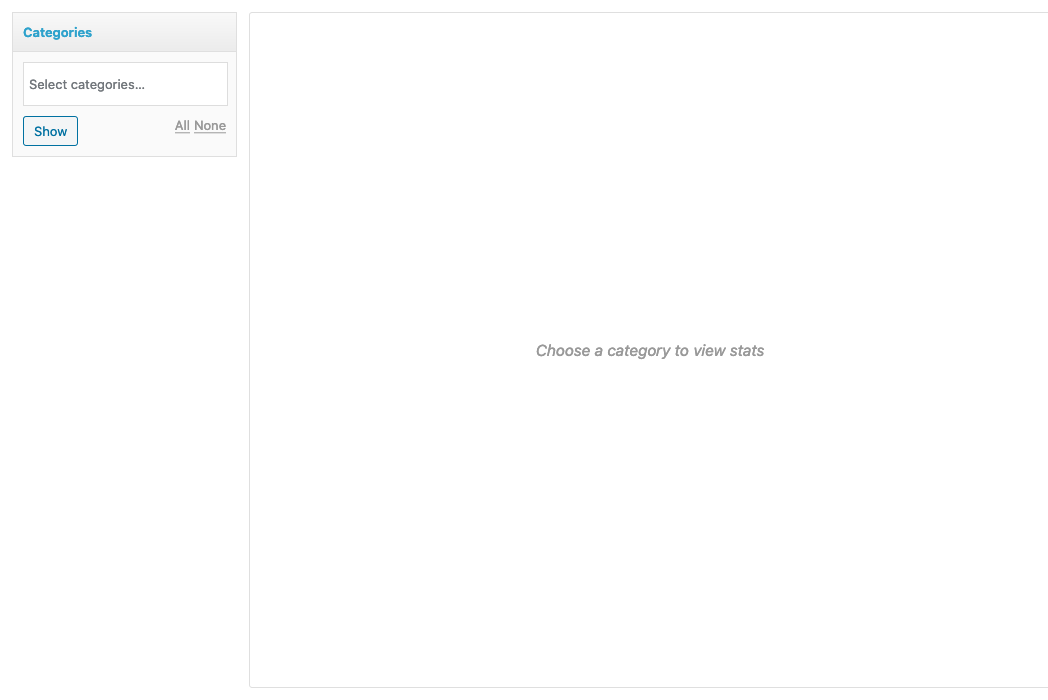
You will now see the categories you’ve selected and their sales report.
Coupons by date
Similar to the previous sections, coupons by date shows discounts in total and number of coupons used, plus provides the ability to filter by coupon, view the most popular coupons, and coupons giving the most discounts.
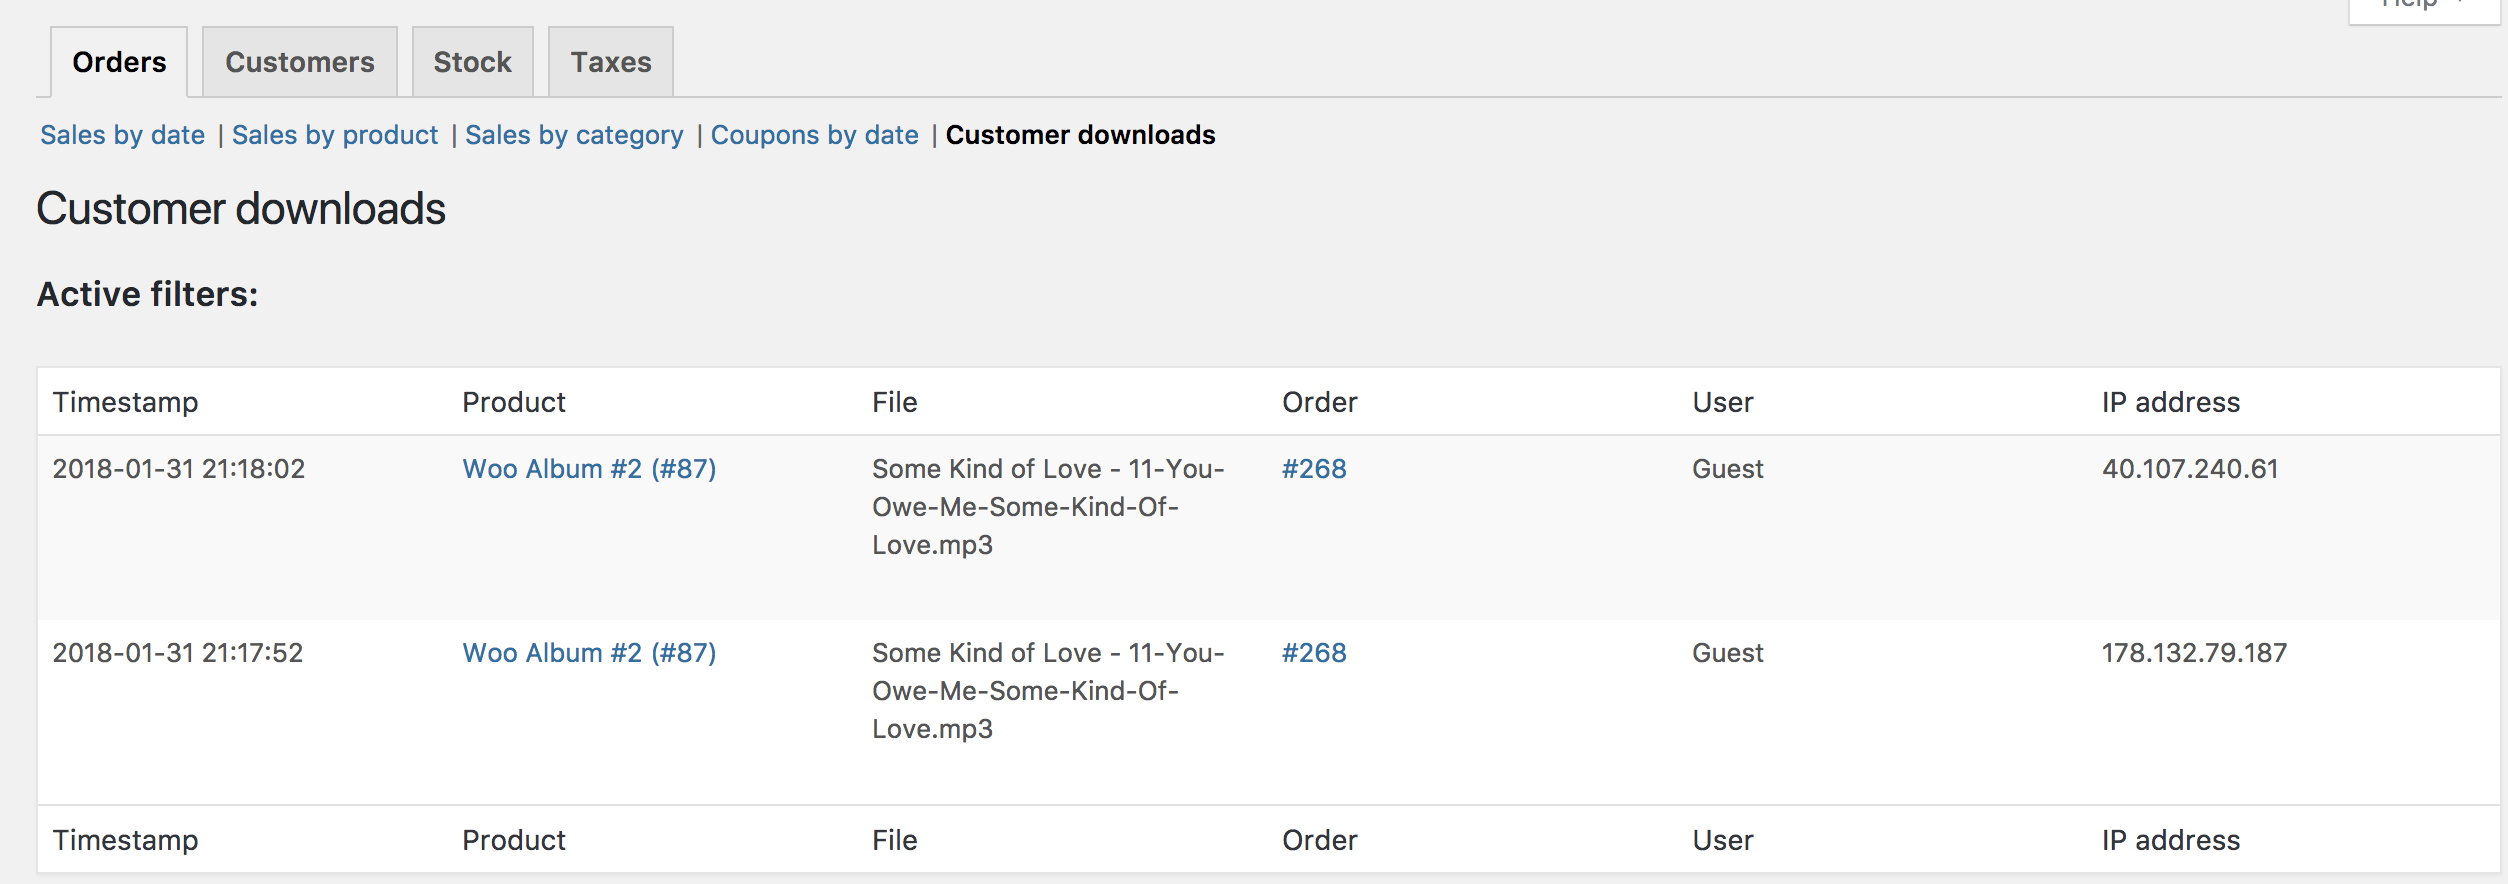
Customer downloads
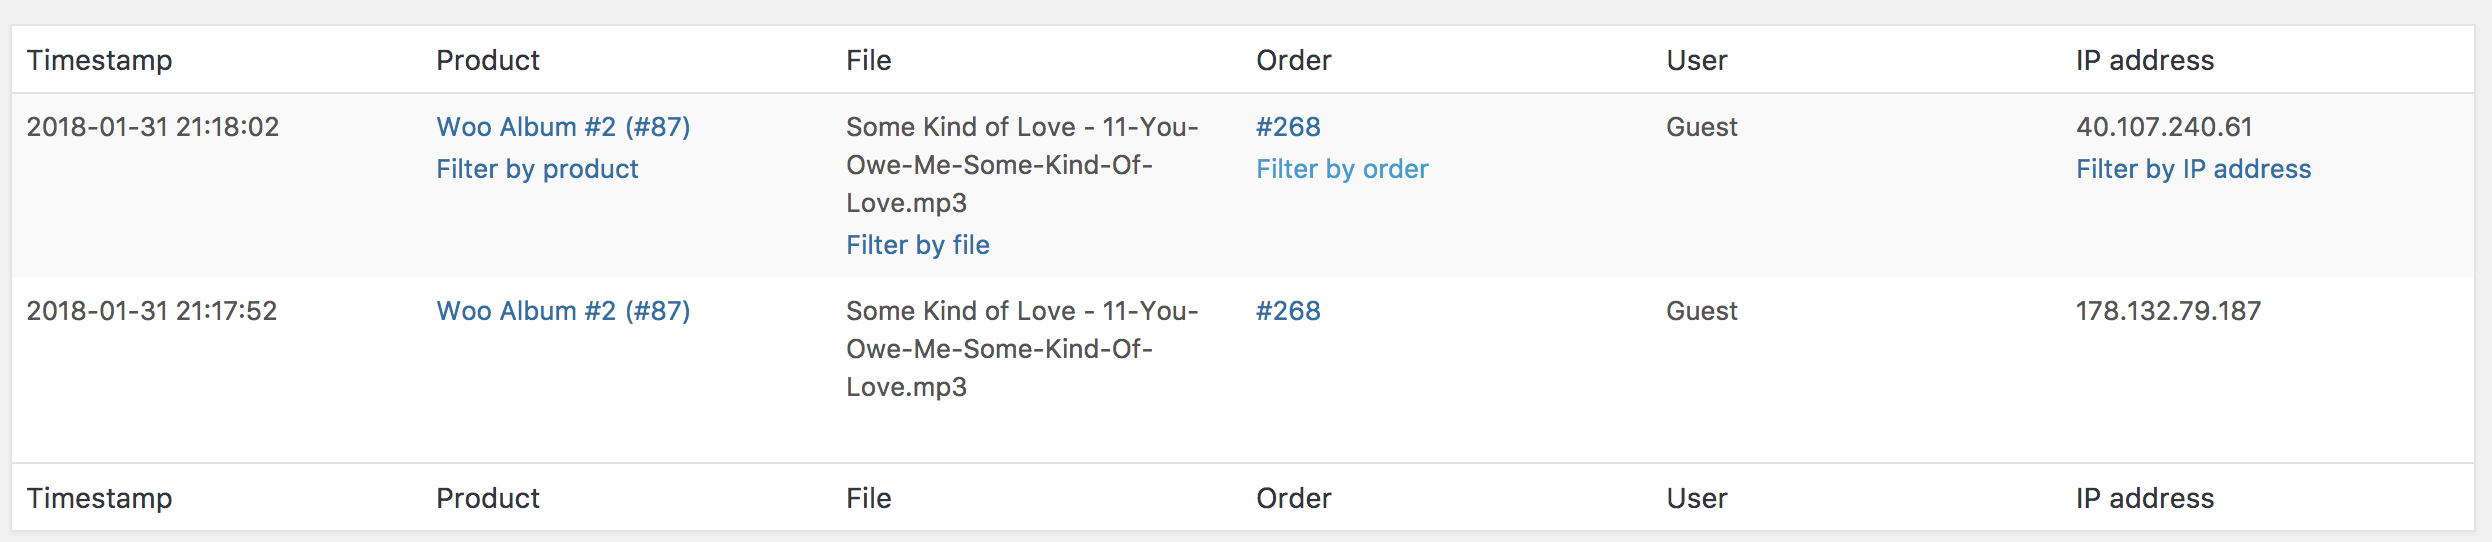
Downloads have unique IDs, enabling them to be tracked and logged, and making it possible to view when it was downloaded, which products and the file name, on what order (clickable link), and where the customer is located via IP address.
It’s also possible to filter downloads by hovering over Product, Order or IP address.
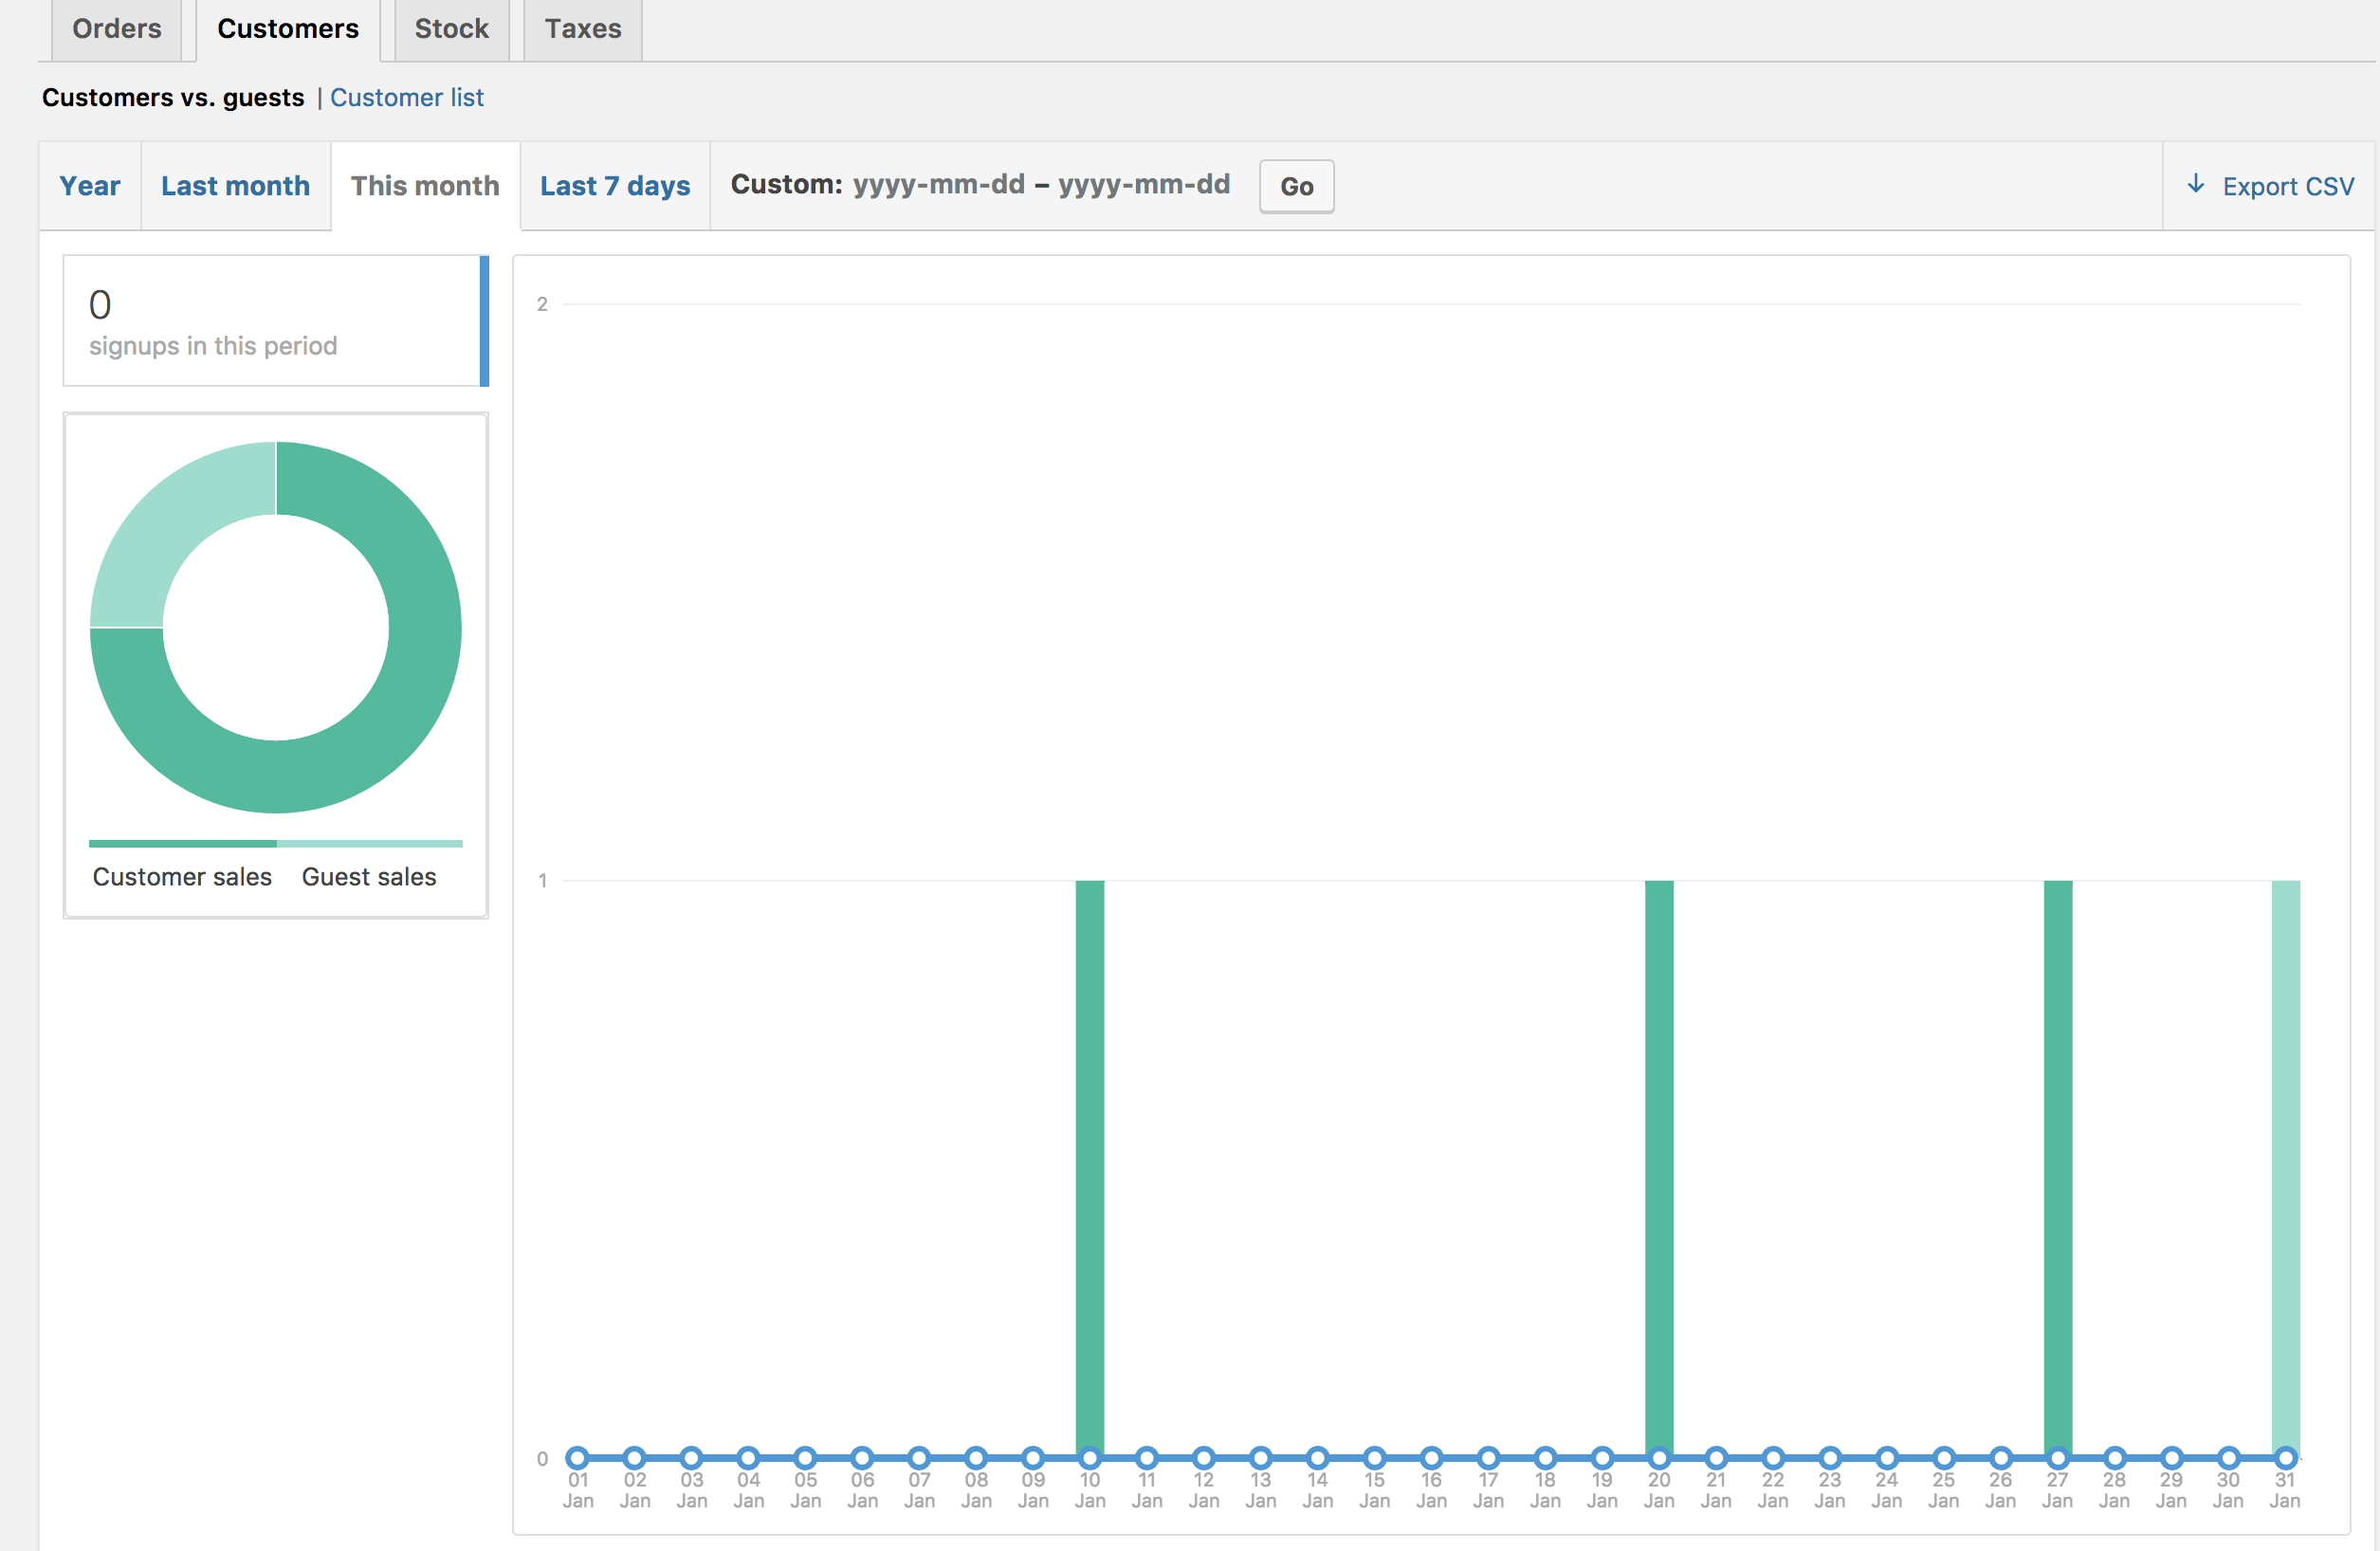
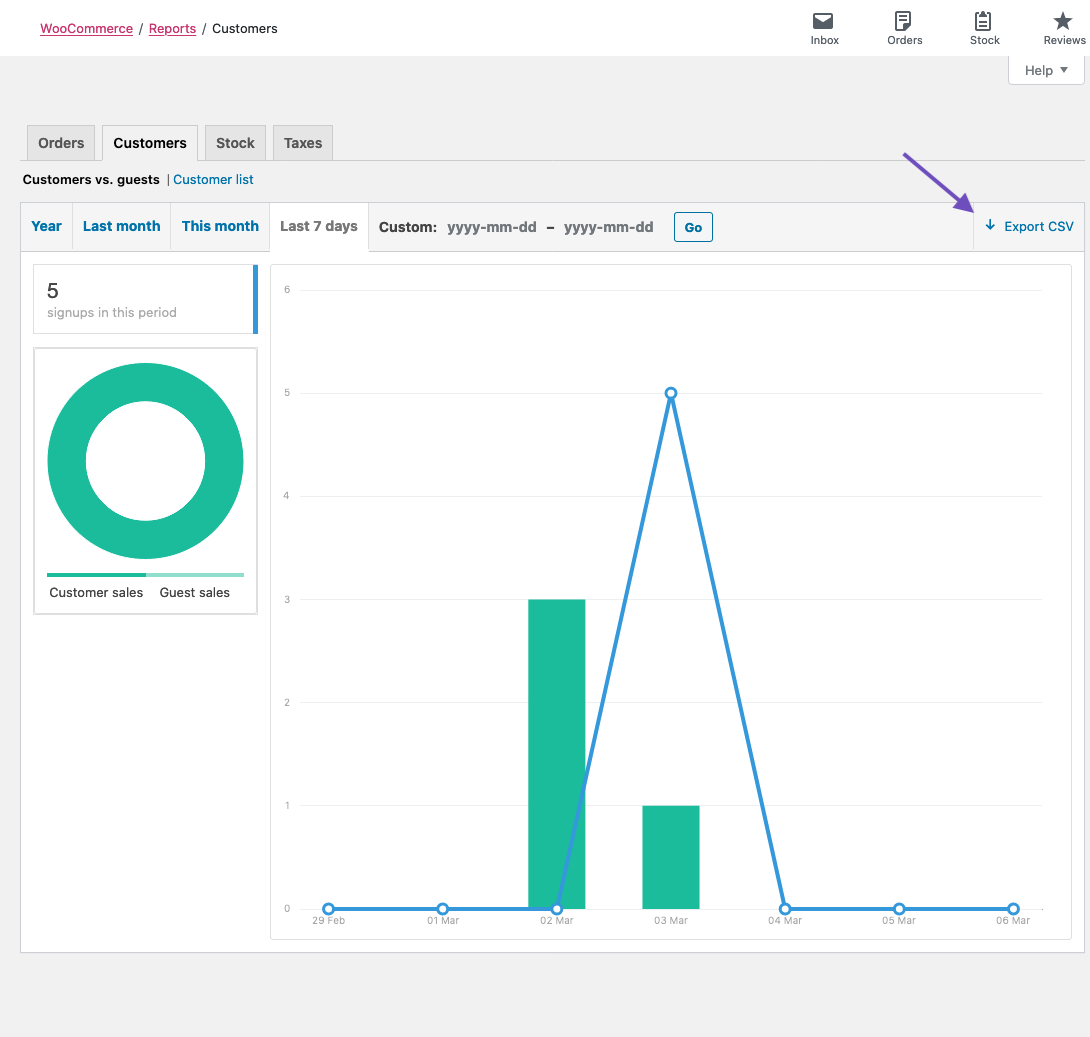
Customers
The Customers tab allows you to view reports for Customers vs. Guests and Customer List with options to further sort by year, last month, this month, last 7 days, and custom.
- In Customers vs. Guests, customers are paying users who register on your website.
- Customer List only shows registered users.
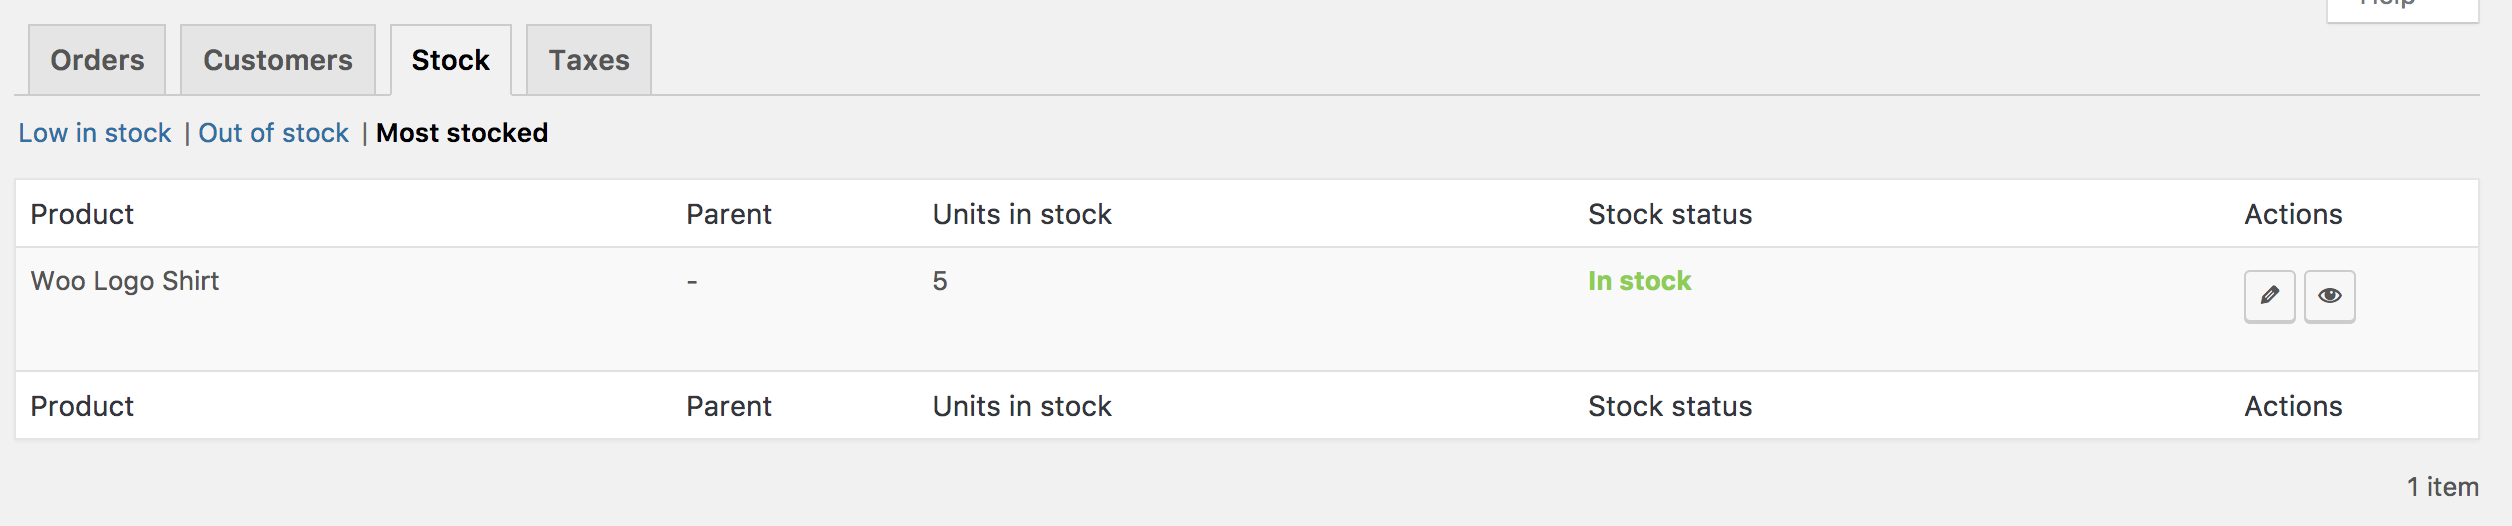
Stock
Stock lists your low in stock, out of stock items, and most stocked products.
Taxes
The reports for Taxes allows you to view Taxes by code (state) and Taxes by date. by year, last month, this month and custom dates you enter.

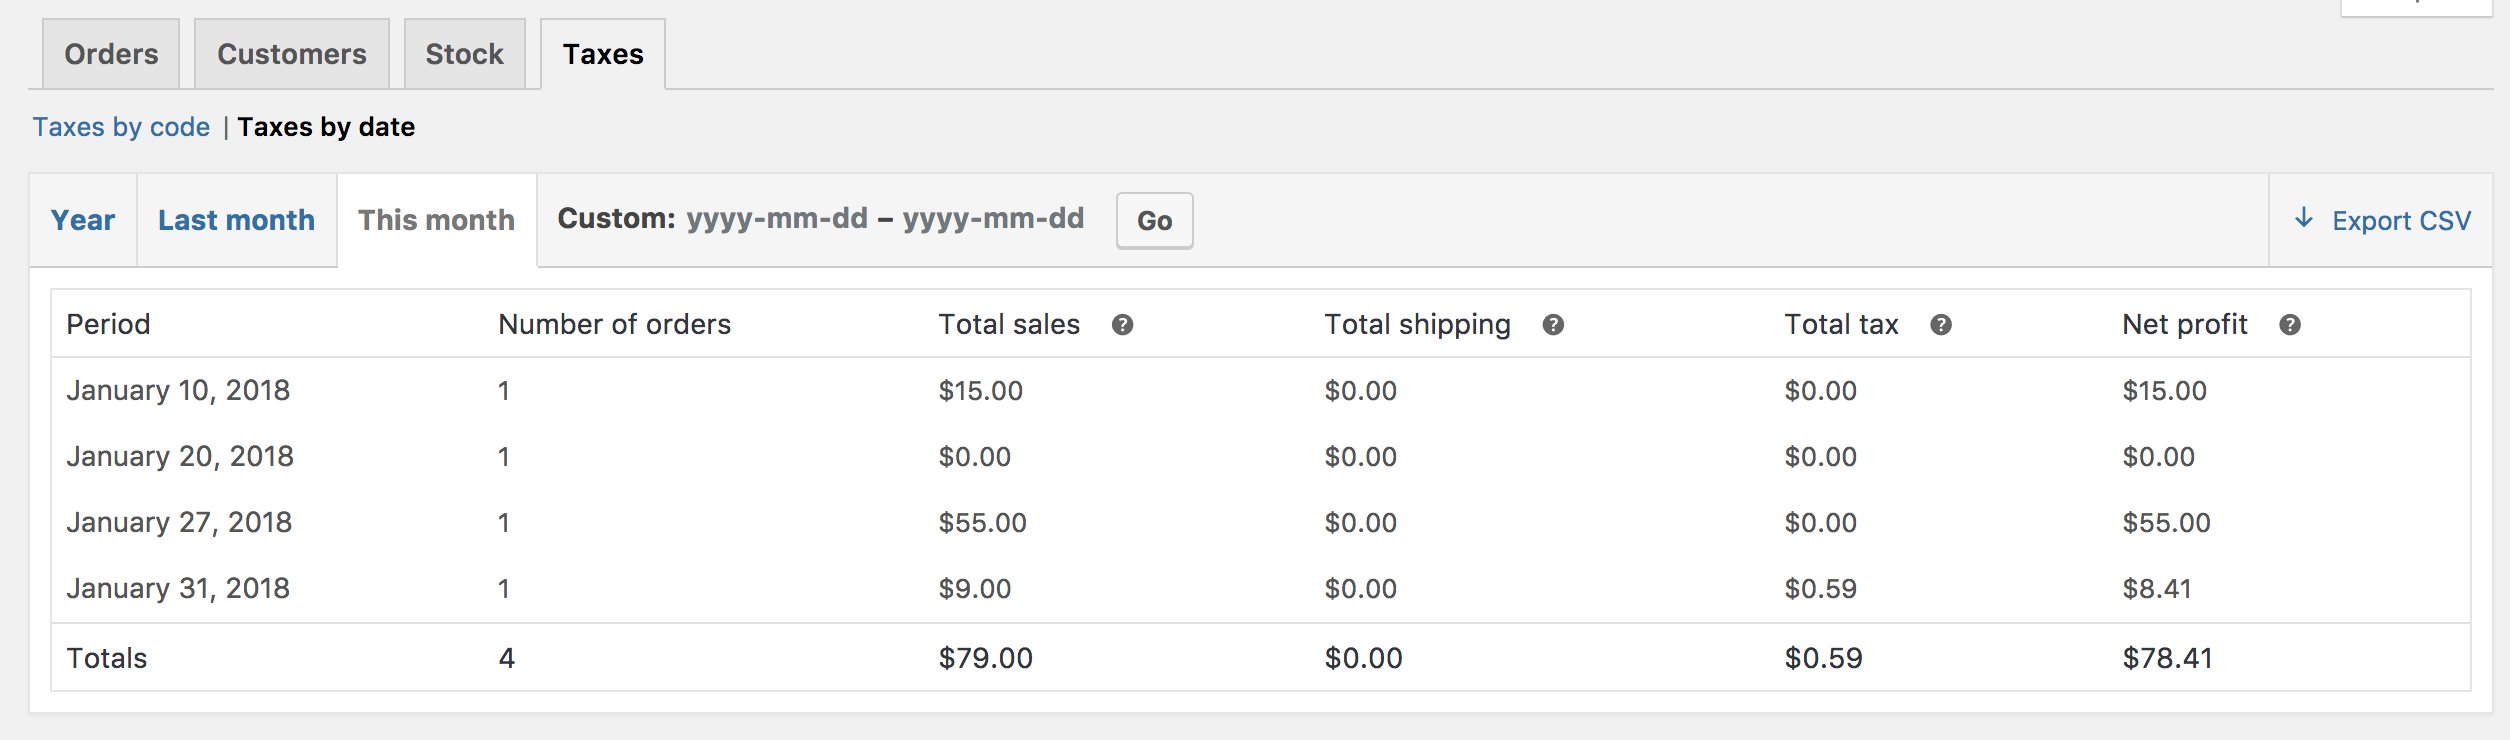
Export CSV
All reports besides the stock one have the option to export to CSV.
- Select Export CSV
- Save or view the file
The Export CSV feature is hidden from browsers without support for the Download property.
Frequently Asked Questions
How do I reset the report?
Everything is reset if you delete prior sales orders and then go to the order Trash and permanently delete them. Because all sales graphs and sales logs are dynamically generated, you then need to clear your browser cache.
Is there a ___ column for this report?
The only columns and categories available are those shown. If you require a different or additional one, then it would be customization requiring custom code or a plugin to add that feature/functionality.