WooCommerce Analytics only works with WordPress 5.3+.
WooCommerce Analytics is a new reporting and data analysis tool to help you manage your WooCommerce Store. The suite introduces nine new reports along with advanced filtering and segmenting tools, the ability to download all data to CSV, and a customizable dashboard to monitor all the important key metrics of your site.
Since there is a great deal of functionality in Analytics, the sections in the Table of Contents in the right sidebar will be discussed.
Analytics Basics
Most of the new reports in the WooCommerce Analytics section have a set of common tools. This document will introduce you to those features, and how they can be utilized to customize and dive deeper into the various new analytics reports.
Navigate to Analytics > Revenue to get started.
Definition of Terms
The table below describes how different metrics within WooCommerce Analytics are calculated.
| TERM | DESCRIPTION |
|---|---|
| Gross Sales | Sale price of product(s) multiplied by quantity ordered. Does not include refunds, coupons, taxes or shipping |
| Total Sales | Gross Sales – Returns – Coupons + Taxes + Shipping |
| Net Sales | Gross Sales – Returns – Coupons (referred to as “Sales” in the legacy WooCommerce Reports) |
| Orders | The number of new orders placed for a selected date range |
| Average Order Value | Net Sales / Orders |
| Items Sold | The discrete number of items sold. |
| Refunds | Money returned to the customer via a refund |
| Discounted Orders | The count of orders with a coupon applied. |
| Net Discount Amount | Total sum of discounts from coupons. |
| Total Tax | Order Tax + Shipping Tax |
| Order Tax | The total of tax applied to items in an order |
| Shipping Tax | The total of tax applied to shipping in an order |
| Shipping | The shipping charges associated with an order or refund. |
| Downloads | Total count of downloaded files |
Refunds
Refunds are reported on differently in WooCommerce Analytics than in the legacy WooCommerce Reports.
In WooCommerce Analytics:
- Refunds appear as a negative number on the date that the return occurred (not the date the order was placed).
- Refunds include discounts from coupons.
- Refunded shipping charges and refunded taxes are not included in the Refunds summary number or columns. They appear as negative values in the shipping and taxes summary numbers and columns respectively.
Date Range Picker
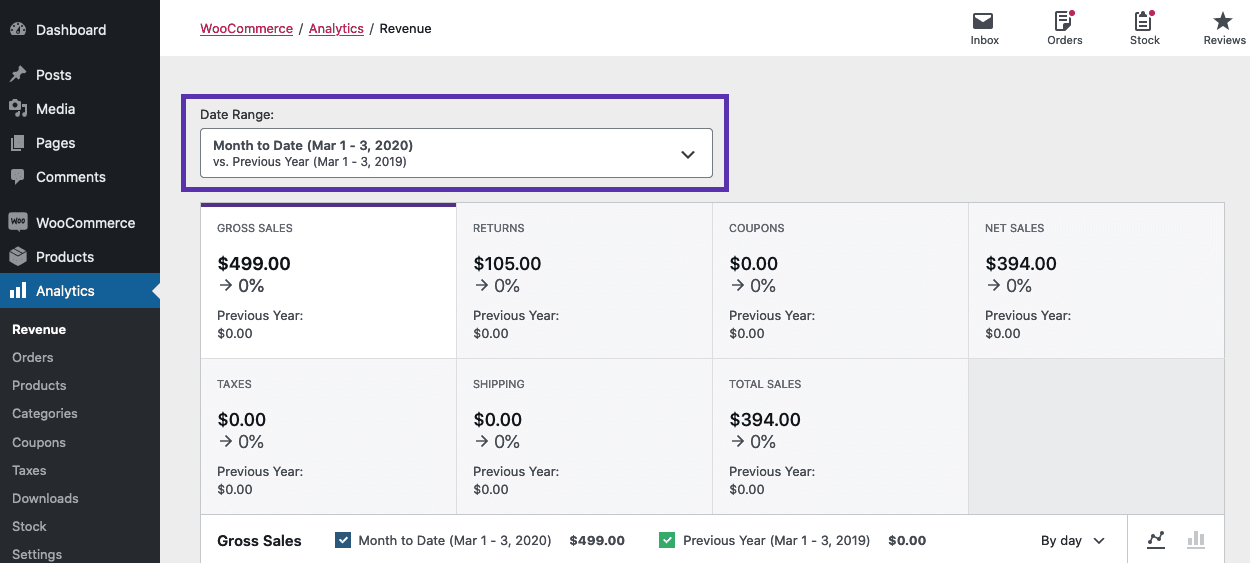
The Date Range picker allows you to specify which dates you want to include in the report being viewed. When you first open the Date Range Picker, a variety of popular presets allow you to quickly choose some common date ranges:
- Today
- Yesterday
- Week to Date
- Last Week
- Month to Date
- Last Month
- Quarter to Date
- Last Year
You can also select which date range to compare against, either the same range from the “Prior Year” or the “Prior Period.”
If the presets don’t match your desired date range, click the “Custom” tab at the top of the picker to have more granular control over the date range:
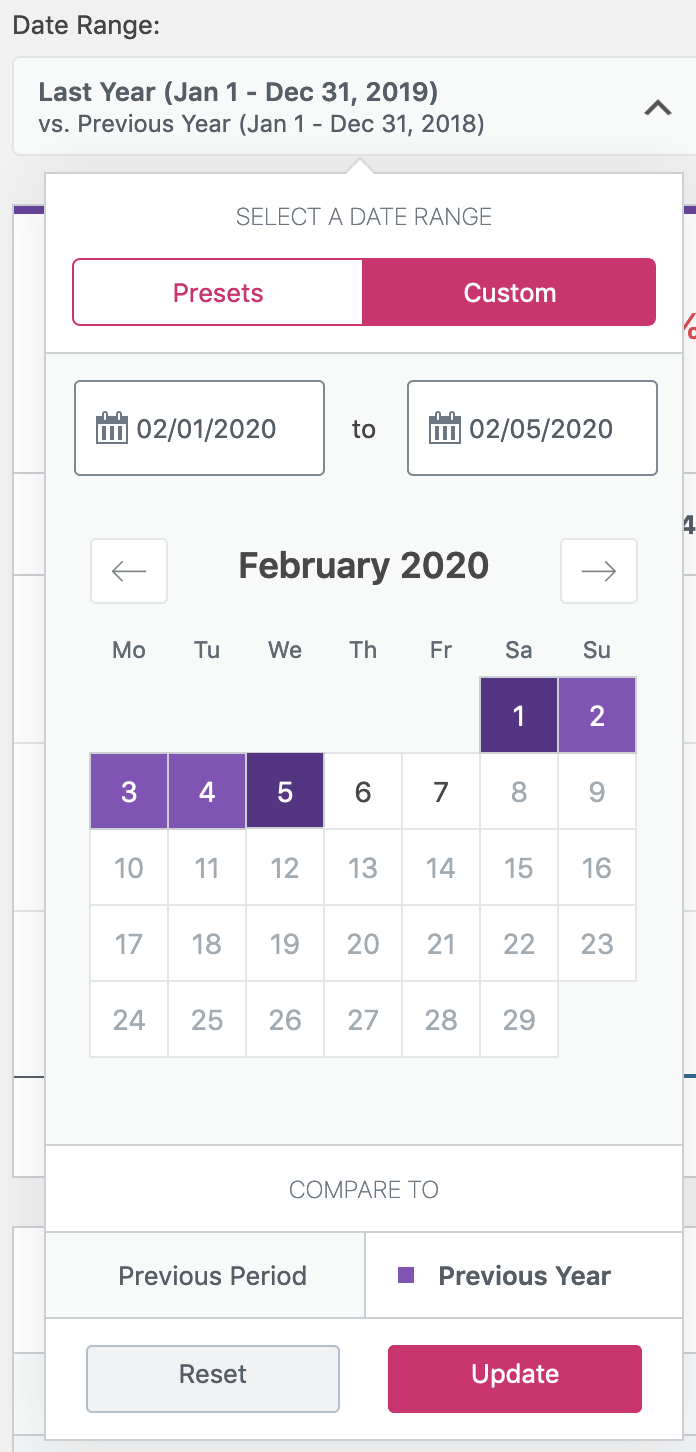
On the custom picker, you can either manually enter the start and end date using the provided input fields, or use the calendar to make your selection.
After either choosing a preset, or a custom date range, click the Update button to modify the data in the report. Note by doing this, the date range selected is added to the address of the report URL – which allows you to bookmark, or share a report URL with a specific date range to other Store admins. This date selection is persisted on the report view until you navigate away from the report.
Advanced Filters
Depending on the report you are viewing, there might also be other Quick Filters and/or Advanced Filters that allow you to further customize the data set being viewed.

If filter options are available, they will be shown next to the Date Range picker, or below it on narrow/mobile viewports. Much like the date range selection, filters are also persisted to the URL which allows you to save a quick link to a specific filtered version of a report. Available filters for each report are covered more in-depth in each report’s documentation.
Summary Numbers / Chart
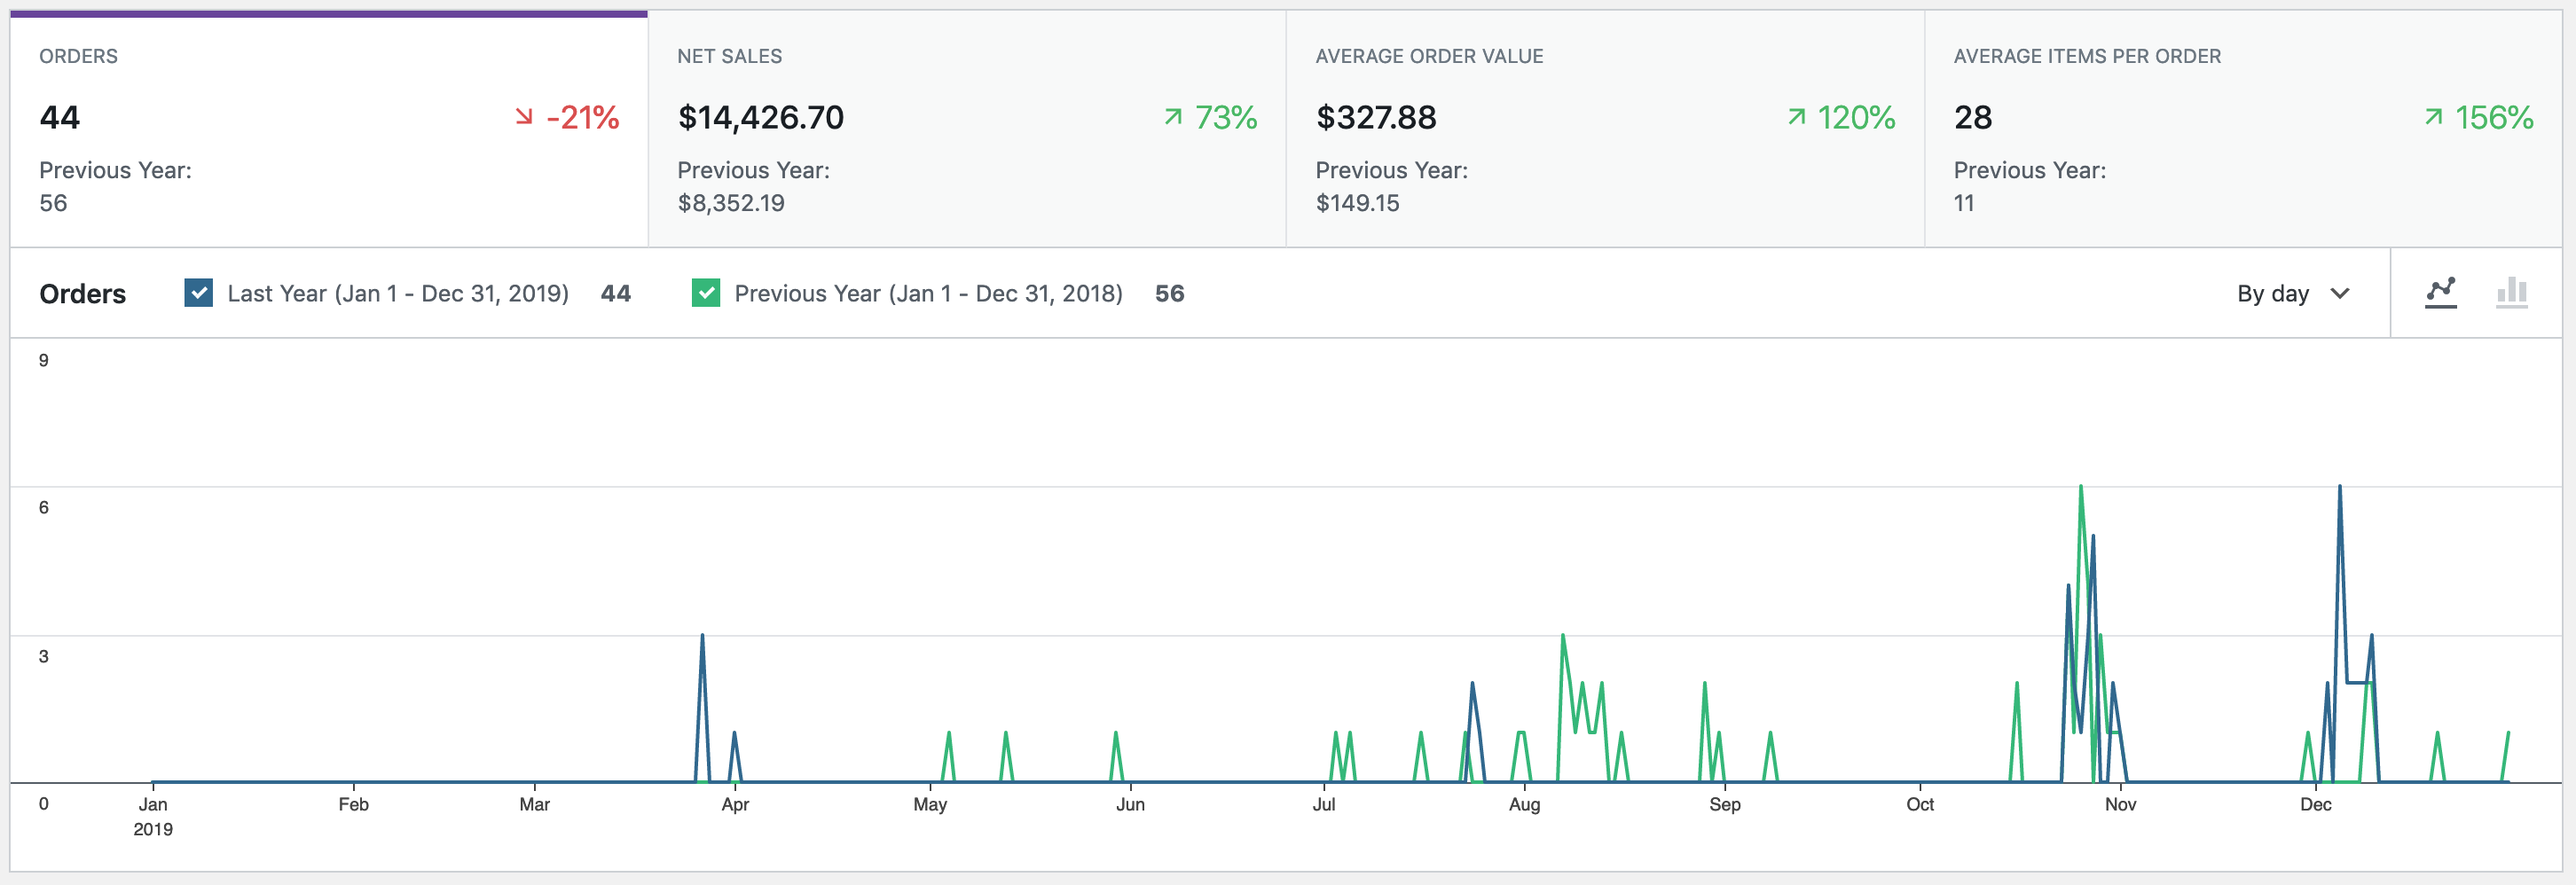
At the top of the reports, the Chart and Summary numbers offer quick access to key data, trends of that data, and visualizations for changes over time in the period selected, and the period being compared against.
Summary Numbers
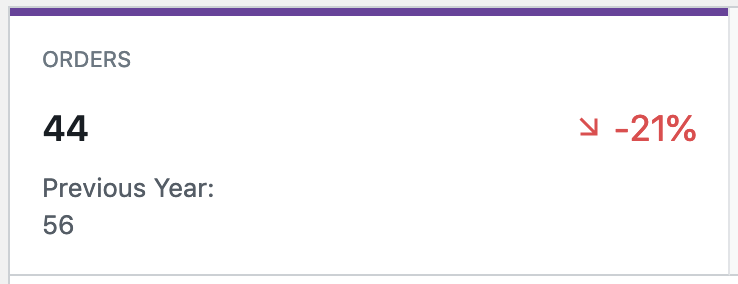
The “Summary Number” tab gives you a quick view of the total figure for that metric over the period selected, the total number for the period being compared, and the percentage trend between those two figures. By clicking on a Summary Number, that particular metric is then displayed in the chart.
For example, this is what the “Orders Summary Number” looks like:
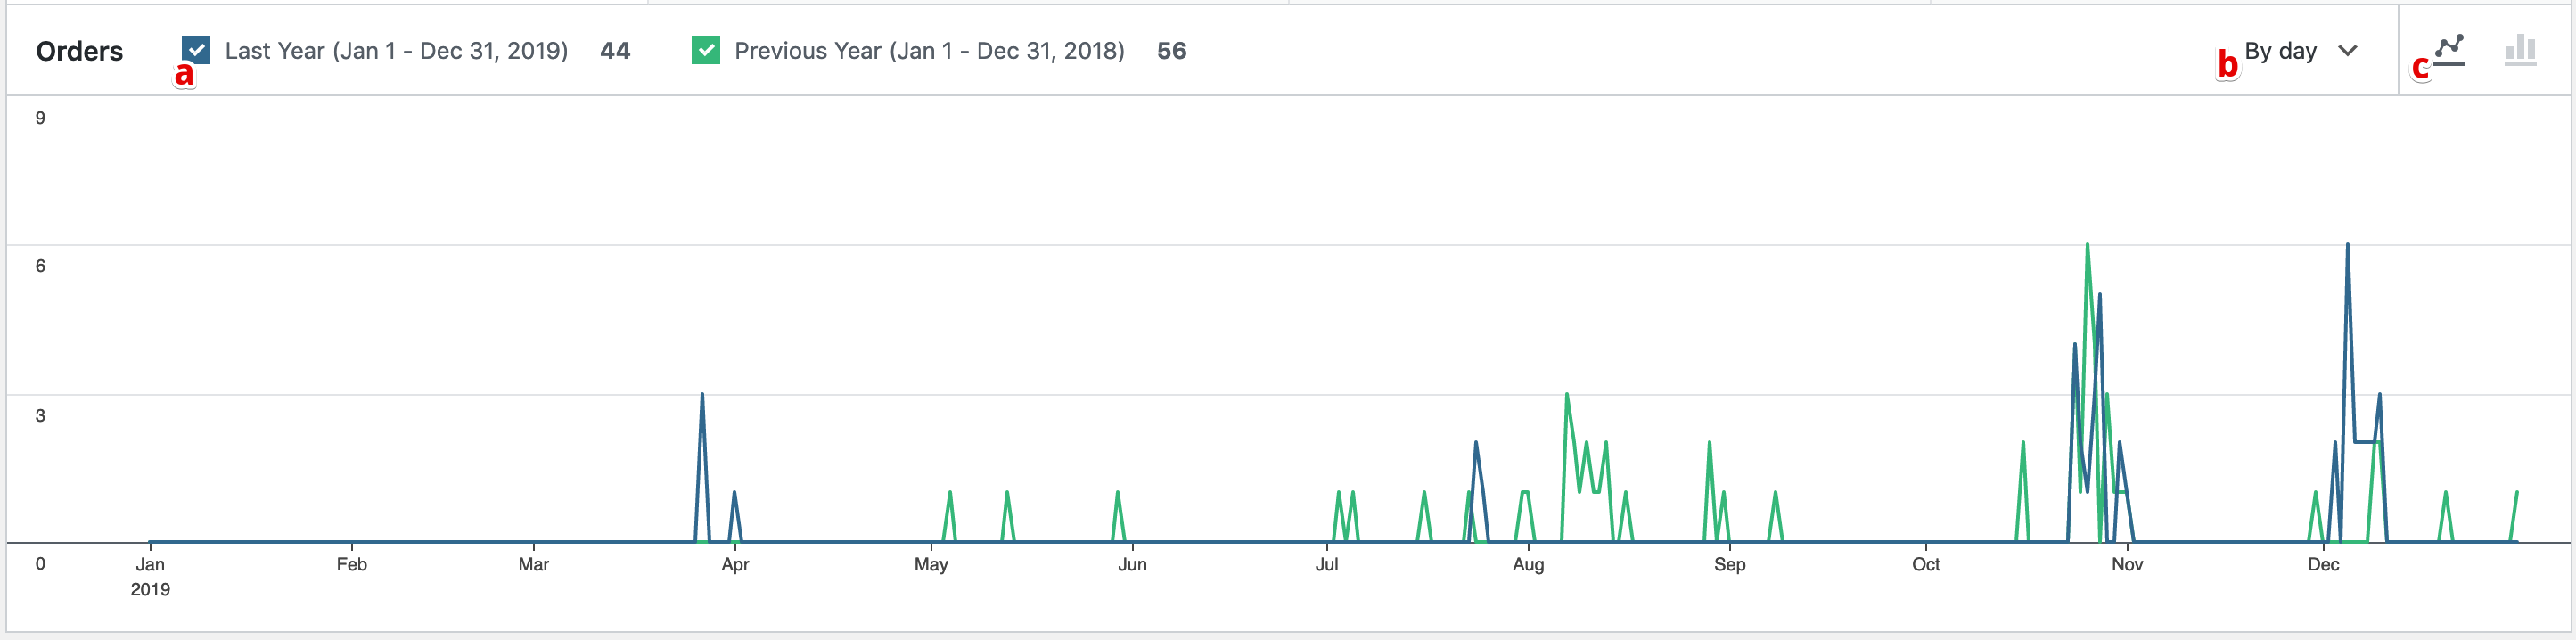
Chart
The charts on report pages offer quite a few options to customize the visualization of data. The “Data Legend” (labeled “a” in the above screenshot) allows you to toggle the visibility of the different data set periods. The “Interval Selector” (labeled “b”) allows you to adjust the interval displayed in the chart. The options available here are dependent upon the length of the date range selected:
| LENGTH OF DATE RANGE | INTERVAL OPTIONS |
|---|---|
| One year or more | ‘day’, ‘week’, ‘month’, ‘quarter’, ‘year’ |
| 90 days to 1 year | ‘day’, ‘week’, ‘month’, ‘quarter’ |
| 1 month – 89 days | ‘day’, ‘week’, ‘month’ |
| 1 week – 28 days | ‘day’, ‘week’ |
| 1 day – 1 week | ‘day’ |
| 1 day | ‘day’, ‘hour’ |
And lastly, you can adjust the “Type of Chart” being displayed (labeled “c”) between a bar or line chart.
Table
The table which displays the detailed data on Analytics reports also has a number of features that allow you to customize how the data is displayed, and even an option to download a CSV copy of the data used in the report for further analysis.

Table Column Sorting
Many columns in reports will allow you to click on the column header to sort the tabular data by that value and to either sort by that value in ascending or descending order. Simply click the column header to sort by that value, and click it again to change between ascending and descending sort.
Toggle Column Visibility
If a report contains a data column that you don’t need to be displayed, you can adjust the visibility of it by using the visibility menu on the right side of the table header. Click the column name in the menu to change the visibility of the column. Your visibility selections are persisted to your user preferences for each report, so on subsequent visits to that report, the columns you have previously toggled off will not be displayed.

Download (to CSV)
If you would like to download a copy of the data contained in the report table, you can do so by clicking the Download button in the table header. If the amount of data shown in the report is limited to one page ( e.g. there are no pagination options shown in the table footer ), the CSV file will download immediately.
If your selected date range results in a data set that spans more then one page in the table, your CSV download will be processed as a background job by WooCommerce. Once the data is ready to be downloaded, an email will be sent to the address that is attached to your WordPress account with a link to download the file.
Table Pagination
When the data displayed in the table is larger than the default single page size of 25, some pagination options will appear in the table footer area. Directional buttons–labeled < and >–enable you to move backward and forward between pages, and a text field will allow you to jump to a specific page number. Furthermore, you can change the number of rows to display per page.
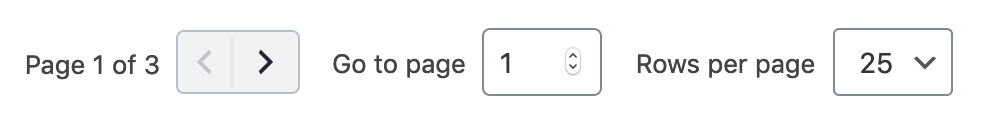
Table Search Box
On some reports, a search box is displayed in the table header area as well. For details on what the search box does on a given report, please refer to the associated documentation for that report.

Analytics Dashboard
The new dashboard in WooCommerce has been designed to allow you to keep track of the statistics and data that matter most to your site. Each section of the dashboard can be fully customized to meet the needs of your store, and also act as launching points to dive deeper into other Analytics Reports.
The dashboard is comprised of three sections:
- Performance Indicators,
- Charts, and
- Leaderboards.
The data presented in these sections are controlled by the Date Picker which appears at the top of the page. This lets you quickly look at data for a number of preset date-ranges like week, month, quarter, and year to date, or to select a specific date range to view.
Navigate to WooCommerce > Dashboard to get started.
Customize Dashboard Sections
These sections can be re-ordered, re-named, or even toggled off if you don’t want to view a particular section(s).
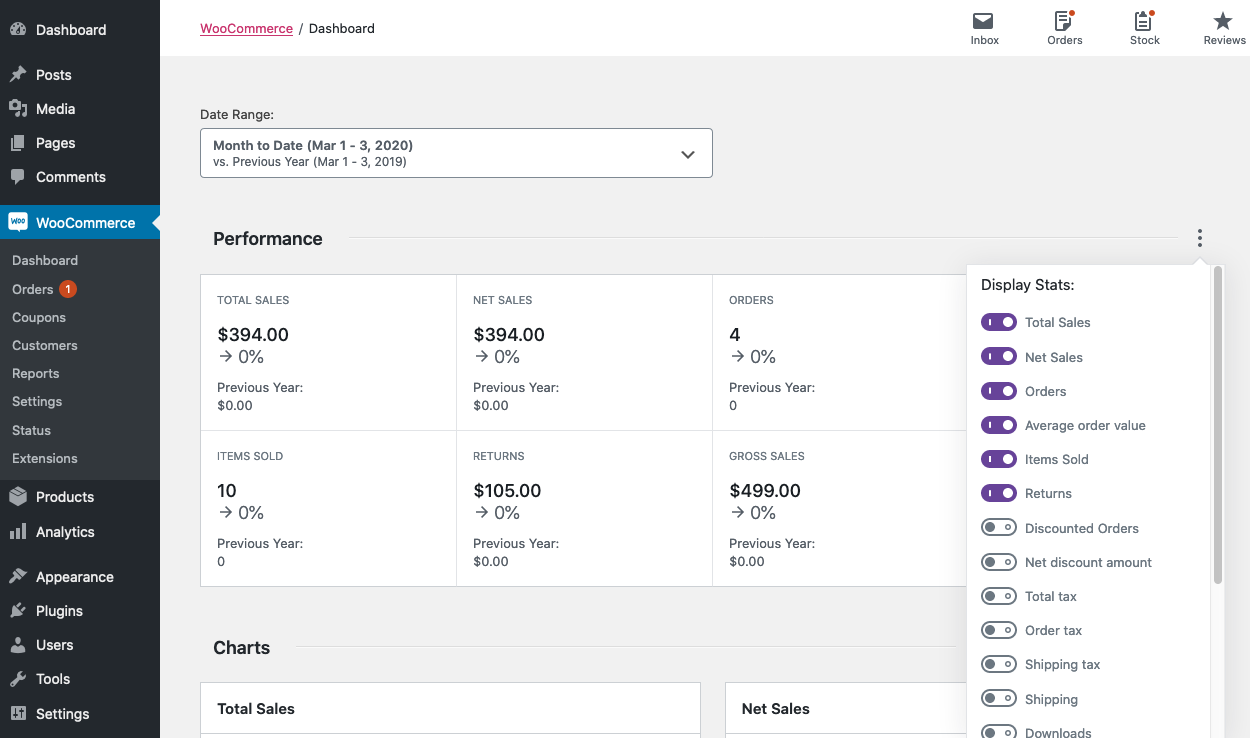
Toggle Stats
To customize dashboard sections, click the kebab menu in the top right corner of the section. The first item that appears in this menu is the ability to toggle the display of the various stats that are shown in the section.
Rename, Move or Remove a Dashboard Section
Below that you will find options for renaming the section, moving it up or down, or removing it entirely from the dashboard.
Add a Dashboard Section
If you removed a dashboard section, or you have an extension installed that adds in an option for a new section, a plus icon will appear at the bottom of your dashboard. Clicking that plus will allow you to insert previously removed sections, or add in new ones.
Performance Section
By default, the Performance Indicators section is what appears at the top of your dashboard below the Date Picker. Each performance indicator will display a label informing you of the statistic that is being presented, the value of that statistic for the date range selected, a percentage change over the prior period along with a trend arrow of up/down/same, and the value for the previous period that is being compared.
Beyond giving you a quick glimpse into the statistic, Performance Indicators also act as a quick shortcut to dive deeper into the data behind the stat. For example, clicking on the Total Sales indicator will open up the Revenue Report for the date range that has been selected on the Dashboard. From there you can view associated charts and tabular data for deeper analysis.
Using the customization menu in the top right corner of the section, you can toggle the display of the following default performance indicators:
| INDICATOR NAME | DESCRIPTION | LINKS TO (REPORT NAME > CHART NAME) |
|---|---|---|
| Total Sales | Gross Sales – Returns – Coupons + Taxes + Shipping | Revenue Report > Total Sales |
| Net Sales | Gross Sales – Returns – Coupons | Revenue Report > Net Sales |
| Orders | The number of new orders placed for a selected date range | Orders Report > Orders |
| Average Order Value | Net Sales / Orders | Orders Report > Average Order Value |
| Items Sold | The discrete number of items sold. | Products Report > Items Sold |
| Refunds | Money returned to the customer via a refund | Revenue Report > Refunds |
| Discounted Orders | The count of orders with a coupon applied. | Coupons Report > Orders Count |
| Net Discount Amount | Total sum of discounts from coupons. | Coupons Report > Amount |
| Total Tax | Order Tax + Shipping Tax | Taxes Report > Total Tax |
| Order Tax | The total of tax applied to items in an order | Taxes Report > Order Tax |
| Shipping Tax | The total of tax applied to shipping in an order | Taxes Report > Shipping Tax |
| Shipping | The shipping charges associated with an order or refund. | Revenue Report > Shipping |
| Downloads | Total count of downloaded files | Downloads Report > Download Count |
| Gross Sales | Sale price of product(s) x quantity ordered. Does not include refunds, coupons, taxes or shipping | Revenue Report > Gross Sales |
Charts Section
The next section displayed by default is Charts. The customization menu again allows you to toggle the display of charts that are most useful for your Store. The following charts are available to display in this section:
| CHART NAME | DESCRIPTION | LINKS TO (REPORT NAME > CHART NAME) |
|---|---|---|
| Total Sales | Gross Sales – Returns – Coupons + Taxes + Shipping | Revenue Report > Total Sales |
| Net Sales | Gross Sales – Returns – Coupons | Revenue Report > Net Sales |
| Orders | The number of new orders placed for a selected date range | Orders Report > Orders |
| Average Order Value | Net Sales / Orders | Orders Report > Average Order Value |
| Items Sold | The discrete number of items sold. | Products Report > Items Sold |
| Refunds | Money returned to the customer via a refund | Revenue Report > Refunds |
| Discounted Orders | The count of orders with a coupon applied. | Coupons Report > Orders Count |
| Gross Discount Amount | Total sum of discounts from coupons. | Coupons Report > Amount |
| Total Tax | Order Tax + Shipping Tax | Taxes Report > Total Tax |
| Order Tax | The total of tax applied to items in an order | Taxes Report > Order Tax |
| Shipping Tax | The total of tax applied to shipping in an order | Taxes Report > Shipping Tax |
| Shipping | The shipping charges associated with an order or refund. | Revenue Report > Shipping |
| Downloads | Total count of downloaded files | Downloads Report > Download Count |
Chart Interval Options
The charts section has a setting that allows you to set the time interval to display in the charts. The options displayed in the interval drop down are determined by how long of a date range you currently have selected in the Date Picker.
| LENGTH OF DATE RANGE | INTERVAL OPTIONS |
|---|---|
| One year or more | ‘day’, ‘week’, ‘month’, ‘quarter’, ‘year’ |
| 90 days to 1 year | ‘day’, ‘week’, ‘month’, ‘quarter’ |
| 1 month – 89 days | ‘day’, ‘week’, ‘month’ |
| 1 week – 28 days | ‘day’, ‘week’ |
| 1 day – 1 week | ‘day’ |
| 1 day | ‘day’, ‘hour’ |
Chart Type Option
The last way you can customize the appearance of the charts is the ability to toggle between Line and Bar charts. Your selection chosen here will be saved to your user options and used on subsequent visits to the WooCommerce Dashboard.
Leaderboards Section
The final section on the Dashboard allows you to view four different “Leaderboards” for your store’s statistics. Like the other two sections, you can also toggle the visibility of the leaderboards via the customization menu. By default you have the following four Leaderboards to choose from:
- Top Customers, Total Spend
- Top Coupons, Number of Orders
- Top Categories, Items Sold
- Top Products, Items Sold
Analytics Settings
WooCommerce Admin is pre-configured with default settings for WooCommerce Analytics.
Navigate to Analytics > Settings to change these default settings.
These settings are broken down into sections:
- Excluded Statuses
- Actionable Statuses – See Activity Panels for details
- Default Date Range
- Import Historical Data
- Reset Defaults
Excluded Statuses

In this section, statuses that are unchecked are included in analytics reports. Checked statuses are excluded. If your store uses custom order statuses, those statuses are included in the reports by default. They will be listed in this section under Custom Statuses and can be excluded via the status checkbox.
Actionable Statuses
See Activity Panels for details.
Default Date Range

WooCommerce Admin is pre-configured with a default date range of Month to Date. This is the date range that will be used when loading the WooCommerce Dashboard or Analytics page from any non-WooCommerce Admin page. Any reports that support a date range will have a Date Range Picker to allow changing the date range for the report.
Importing Historical Data
When you install WooCommerce 4.0 (or the WooCommerce Admin plugin) the new Analytics functionality needs to process the historical data in order to populate new Report pages. This is not done automatically – extremely large or high volume stores might want to schedule a maintenance window in which to import their historical data.
Stores with existing Orders will be prompted to import their data:

Starting the Import
To start a historical data import, use the prompt above or go to Analytics > Settings, and scroll down to Import Historical Data.
Stores that only want to see report data from a certain date onward can choose a date period, otherwise “all” data will be imported.
Extremely large or high volume stores might choose to import data in smaller increments – perhaps each year or quarter separately. The “skip previously imported customers and orders” control allows for overlapping date ranges to be imported without unnecessary data processing.
The Customer and Order counts will be updated in real-time to reflect changes made to the import settings. Press “start” when you’re ready for the import to begin.
Monitoring Progress
Once you’ve started an import, progress will be periodically updated on the Analytics > Settings screen.
Navigating away from this page will not affect the import, and you can return to it at any time to monitor progress.
Once the import is complete, the status will reflect it:
You’ll be given the option to run another import or to delete previously imported data. Please note that deletion is for all analytics data.
How the Import Works
Initial Data Import
The historical data import uses Action Scheduler to queue jobs that process the existing data on your store, building tables of aggregate data to be used in Reports.
Before version 3.0.0, Action Scheduler used custom post types to manage queue data. To avoid problems queuing large numbers of items, the import jobs are queued and processed in batches to reduce the likelihood of execution time limits on servers/hosts with limited resources.
Subsequent Data Updates
All Customers and Orders that get created after WooCommerce 4.0 (or the WooCommerce Admin plugin) is installed are automatically queued for processing. Only historical data requires manual intervention to process.
Action Scheduler at Scale
For extremely large or high volume stores, we recommend following the Action Scheduler documentation for Background Processing at Scale.
If you’re using WooCommerce 3.9 or earlier, the bundled version of Action Scheduler uses a custom post type to manage queues. This can cause performance issues for high volume stores. We recommend installing the Action Scheduler plugin at version 3.0.0 or later. Action Scheduler 3.0.0+ uses custom database tables for queue handling and is significantly faster than previous versions.
Reset Defaults
The “Reset Defaults” button resets the settings to default values for all of the settings above the button. It has no effect on the data imported via Import Historical Data.
Categories Report
The Categories Report provides insight into the product categories of your store.
By default, the Categories report is sorted by the number of Items Sold by category descending.
Report Totals
The total of the rows in the report may not equal the totals at the bottom of the report for two reasons:
- Products can be assigned more than one category. The sales amounts for a product is included in the totals of all assigned categories.
- The sales amounts for children/descendant categories are both shown in the report for that category and included in the totals of the parent category(ies).
Categories Filters
When the Category report loads it includes all categories for the selected date range. The Category filter dropdown has two filter options:
For either filter, begin typing the name of the category. While you are typing the name of the category the filter will lookup category names that contain the string you have entered.
Single Category
This filter loads the report Categories report listing the products sold within that category.
Comparison
This filter loads the report for two or more categories that you have selected.
A second way you can compare categories is using the checkboxes in the table and the Compare button at the top of the table.
Search
At the top of the report table is the search box. This allows you to filter the report by one or more categories.
Report Sorting
The report table allows sorting by all columns:
- Category
- Items Sold
- Net Sales
- Products (# of unique products sold)
- Orders (# of orders containing a product in that category)
Report Links
Two of the Categories report columns contain clickable entries:
CategoryProducts
Both links open the Single Category report listing the products sold within that category.
Three of the Single Category report columns contain clickable entries:
Productlink opens the Products report for that productOrderslink opens the Orders report for that productCategorylink opens the Single Category report for that category
Coupons Report
WooCommerce 4.0 (and the WooCommerce Admin plugin) includes a new Analytics top-level menu. The Coupons report is under the Analytics menu.
If you have a store with existing Orders, you should Import your Historical Data
Coupon Filters
When the Coupon report loads it includes all coupons for the selected date range. The Coupon filter dropdown has two filter options:
For either filter, begin typing the name of the coupon. While you are typing the name of the coupon the filter will lookup coupon names that contain the string you have entered.
Single Coupon
This filter loads the report for the coupon you have selected.
Comparison
This filter loads the report for two or more coupons that you have selected.
Search
At the top of the report table is the search box. This allows you to filter the report by one or more coupons.
Report Sorting
The report table allows sorting by the following columns:
- Coupon Code
- Orders (Number of orders)
- Amount Discounted
Report Links
Two of the report columns contain clickable entries:
Coupon Codelink opens the Coupons report for that coupon codeOrderslink opens the Orders Report filtered to orders which used that coupon
Customers Report
The Customers Report provides insight into the customers of your store – where they live, when they may have registered, and how they’ve spent money.
Both registered customers and guests are shown in the report. If a guest checks out using the same email address more than once, their orders will be associated with each other (and they will be considered the same purchaser).
Single Customer View
This option loads the report for the customer you have selected.

Advanced Filters
There are several filters available to the Customers Report:
- Name
- Country
- Username
- Orders (count)
- Total Spend
- AOV (Average Order Value)
- Registered
- Last Active
A special note about the Name, Username, Country, and Email filters:
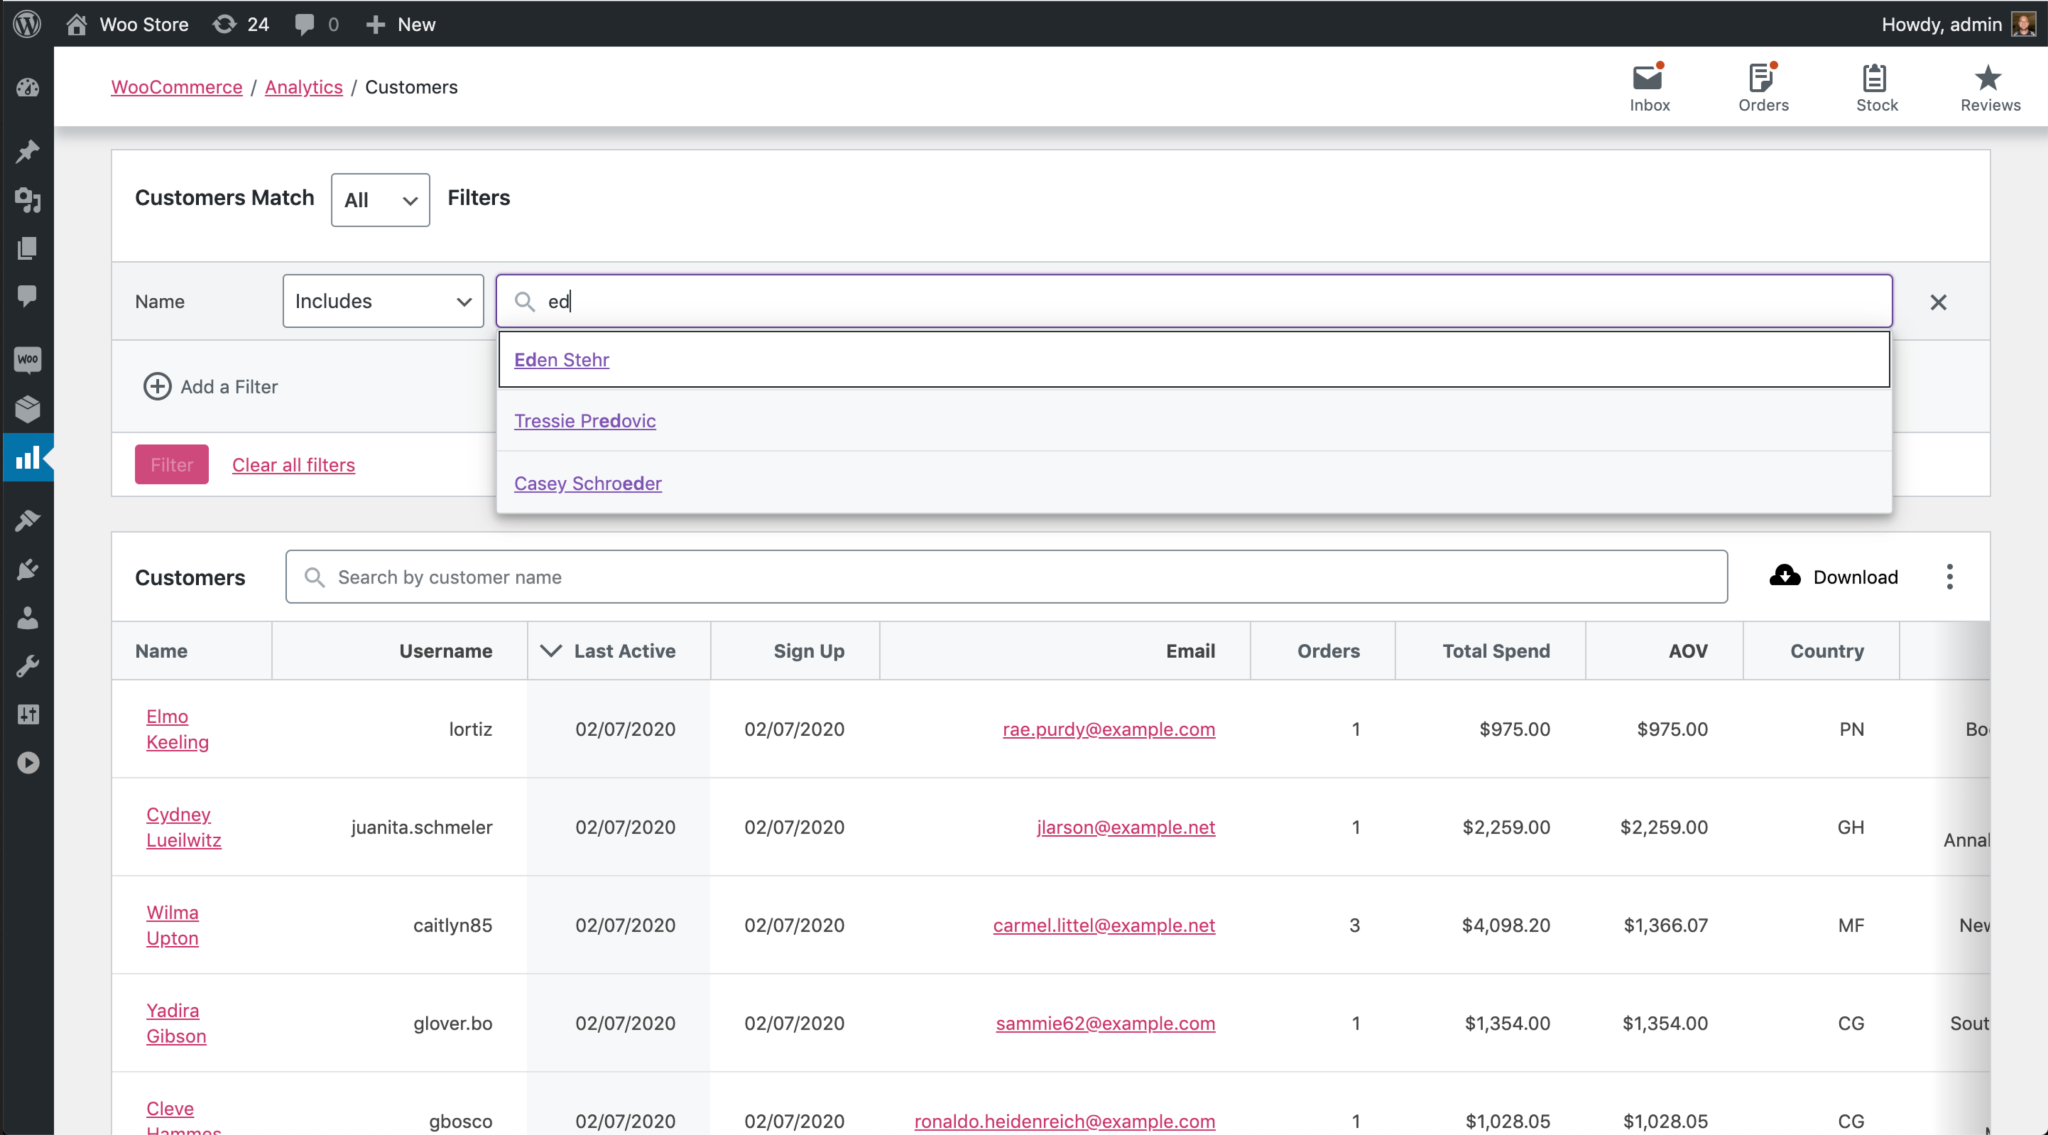
Unlike the table search, these filters do not allow for a partial match on customers. Instead, they provide an easy way to filter the report down to specific names, countries, etc.
Report Search
The search control at the top of the report table provides a quick interface to filter the report to one or more specific customers, searching by name.
It also allows partial string matching on customer names.
Report Sorting
The report table allows sorting by the following columns:
- Name
- Last Active
- Sign Up
- Orders
- Total Spend
- Country
- City
- Region
- Postal Code
By default, the report shows the most recently active customers.
Downloads Report
The Downloads Report provides insight into the performance of your store’s downloadable products. Downloads counts are a total including multiple from the same IP address. Please note that dates are representative of UTC time as opposed to local timezone as other reports are.
All Downloads View
By default, the Downloads Report displays the unfiltered All Downloads View. Each download is represented in the table and chart.
Advanced Filters
There are several filters available to the Downloads Report.
- Select “Advanced Filters” in the “Show:” dropdown
- Choose “Add a filter” and then choose one or several of the following filters:
- Product — allows filtering based on the downloadable product title.
- Username — allows filtering based on the customer’s username.
- Order number — allows filtering based on the order number.
- IP Address — allows filtering based on the IP address this was downloaded from.
Report Sorting
The report table allows sorting by the following columns:
- Date
- Product Title
Orders Report
The Orders Report provides insight into your store’s orders.
By default, orders with non-excluded statuses are listed by order date descending. Excluded statuses can be edited on the Settings page.
Refunded orders cannot be excluded from the orders report. Refunded orders have two rows in the report: one for the date of the original order and one for the date of refund.
Advanced Filters
The advanced filters allow adding multiple filters to the report. These filters can be applied in two ways:
- All – Orders must match all filters to be included in the report
- Any – Orders must match one or more filters to be included in the report
The following fields can be used for filtering:
- Order Status
- Products
- Coupon Codes
- Customer Type
- Refunds
- Tax Rates
Report Sorting
The report table allows sorting by the following columns:
- Date
- Items Sold
- Net Sales
By default, the report shows the most recent orders.
Products Report
The Products Report provides insight into the sales performance of each product on your store.
All Products View
By default, the Products Report displays the All Products view. All products that have had sales in the specified date range will be shown.
Single Product View
By selecting “Single Product”, you can search for a single product to display report data for.
Comparison Mode
By selecting “Comparison”, you can search for multiple products to display report data for.
You can also use the checkboxes in the report table to select products for comparison. Click “Compare” in the table header to compare the selected products.
Report Search
The search control at the top of the report table provides a quick interface to filter the report to one or more specific products, searching by name.
It also allows partial string matching on product names.
Report Columns
The report table contains the following columns:
- Product Title – links to Single Product view
- SKU
- Items Sold (count)
- Net Sales
- Orders (count) – links to Orders Report filtered by product
- Category – links to Categories Report
- Variations (count)
- Status (in/out stock)
- Stock (inventory quantity)
Report Sorting
The report table allows sorting by the following columns:
- Product Title
- SKU
- Items Sold (count)
- Net Sales
- Orders (count)
- Variations (count)
By default, the report sorts products by most items sold.
Clarifying Terms
“Net Sales” is calculated by subtracting refunds and coupons from the sale price of the product(s).
As an equation, it might look like: (product price * quantity) - refunds - coupons.
Revenue Report
The Revenue Report provides insight into the daily revenue of your store. A row is included for each day whether or not there were any orders on that day.
Report Sorting
The report table allows sorting by all report columns:
- Date
- Orders (# of orders)
- Gross Sales
- Returns (Return amount)
- Coupons (Coupon amount)
- Net Sales
- Taxes
- Shipping
- Total Sales
By default, the report shows the most recent days.
Report Links
The Orders column contains clickable entries that take you to the order edit listing filtered to orders on that date.
Stock Report
The Stock Report provides insight into the inventory of your store. This report is only available on stores with stock management enabled.
Report Filter
The Stock Report allows you to filter the report by stock status. Note: Products that do not have stock management enabled are shown as Out of Stock.
Single Status View
This option loads the report for the stock status you have selected.
Report Sorting
The report table allows sorting by all columns:
- Product
- SKU
- Status
- Stock
By default, the report shows stock ordered by stock quantity ascending.
Report Links
Two of the report columns contain clickable entries:
Productlink opens the Products report for that coupon codeStatuslink opens the WooCommerce Edit Product screen for that product
Taxes Report
The Taxes Report provides insight into taxes collected on your store.
All Taxes View
By default, the Taxes Report displays the All Taxes view. All taxes that have been collected in the specified date range will be shown.
Comparison Mode
By selecting “Comparison” in the “Show” dropdown, search for multiple tax codes to display report data for.
- Search for and add all tax codes you want to compare.
- Select “Compare”.
Alternatively, use the checkboxes in the report table below the graph to select tax codes for comparison. Select “Compare” in the table header to compare the selected tax codes.
Report Search
The search control at the top of the report table provides a quick interface to filter the report to one or more specific tax codes.
It also allows partial string matching on tax codes.
Report Sorting
The report table allows sorting by the following columns:
- Tax Code
- Rate
- Total Tax (Order Tax + Shipping Tax)
- Order Tax
- Shipping Tax
- Orders (count)
By default, the report is sorted by the creation date of the tax codes.
Report Links
The “Tax Code” column links to the Orders Report, filtered by the selected tax code.